Hi!
I recently tried the connector and I have problems with the connector not showing the correct data.
I connected the page url report to LookerStudio and added a metric of Unique Pageviews, this metric seems to only show the the totals of Unique Pageviews of the index page, but not the other pages in the report from Matomo.
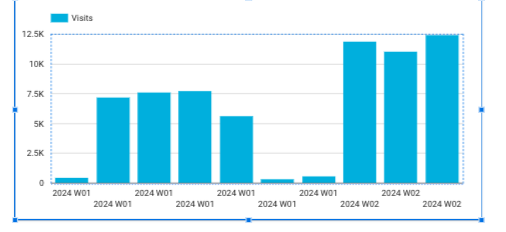
I also have problem with the Date (ISO Year Week) dimension, don’t really know how to explain it in a good way, but it shows the same week in the bar chart several times in a row. I think it sorts the data by day, but tries to visualize it by week, so it just looks really weird.
Looking forward to have this explained and/or solved
Hi Johan, you should actually SUM all the data and will show you the correct information. Specially for Unique Visitors, which by default are calculated on a daily basis.
I have the same problem but can’t solve it with the calculated field approach, because it seems to me like its pulling the data from the wrong source.
In Matomo my Meta campaign shows 1082 Clickout Conversions and 2232 Visits. And some incomplete data from it’s placements
(can’t post with the image upload, because I’m a new user, thats why a link)
When I put those metrics into a table in Looker Studio it shows 4 different rows of the campaign. It’s not pulling the data from the campaign level, its pulling the data from the underlying placements beneath it (the four rows in the first picture: facebook, instagram, etc.).
I created the calculated fields to aggregate it and it worked and showed only one campaign row. But it’s just summing up the second level of the placements. And because they are not accurate and incomplete the data is wrong.
Also, the percentages like in the clickout conversion rate (column three) would just be summed and then divided by four to get the “average”. Even if the data was 100% accurate it would be mathematically very wrong.
Is it possible that the connector pulls the data from the campaign level?
The Campaign Report from the connector is basically showing wrong data. If you ask me it pulls it from the wrong source.
For example: If I use the Visitors from Campaigns metric from the Matomo Main Metrics Report it shows correct data. As it is in Matomo itself.
If I use Visits from the Campaign Report it shows wrong data. Should be the same thing.
The same goes for Conversions. In the Main Metrics Report the Conversions are correct. If I use Conversions from the Campaigns or Goal Metrics Report its wrong.
Maybe those reports pull from a different source?