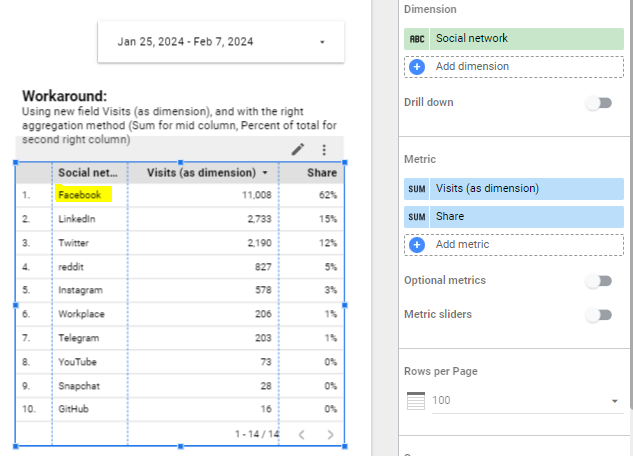
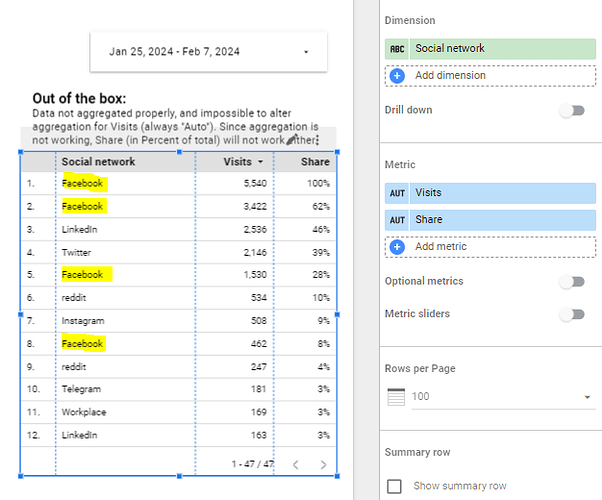
This looks like a generic issue, but I have described a specific case, hopefully making it easier to understand the problem.
CASE: show social traffic shares per social network for previous 14 days
DATA SOURCE:
create a new data source based standard report Referrers > Social Networks
This gives you a data source with the following fields:
Dimensions:
- Date
- Social network
- Website Page
Metrics: - Actions
- Actions per visit
- Avg Time on Website
- Bounce rate
- Conversion rate
- Unique visitors
- Users
- Visits
REPORT:
create new report
- add a date range control to the report, set default data range to Last 14 days
create a table chart in report:
- use the newly created data source as table data source
- table should list each social network, the sum of visits per social network and the social network share of all social traffic
PROBLEM:
- It is not possible to alter aggregation for Visits (it is set to Auto, and no other option exists)
- Usually in Looker Studio, you can select aggregation methods like Sum, Average, Count etc
CAUSE:
This seems to be due to the fact that Visits is made available as a Metric in Looker Studio (instead of Dimension); this choice makes it impossible to change aggregation method (it is always displayed with Aggregation: Auto).
This is different from other Matomo connectors (like the one from Viu). Using the Viu Matomo Connector, all data from Matomo is served as dimensions, hence making it possible to aggregate data on the appropriate level.
From Googles documentation:
Dimension: A set of unaggregated values by which you can group your data.
Metric: A specific aggregation that you can apply to a set of values. Because a metric itself has no defined set of values, you can’t group by it. Metrics in your data source always have a default aggregation of Auto, which can’t be changed.
EFFECT:
We are not able to present data on the aggregate level of our choice.
Switching from commercial Matomo connectors to Matomos own connector for Looker Studio will be a far more cumbersome process than it ideally should have been. There is a workaround (see below), but that involves a lot of work if you have many or complex reports.
Should instead all data from Matomo connector be made available as dimensions, or should we at least have a choice to select either dimension or metric when creating data source?
WORKAROUND:
Add a new calculated field in Looker Studio (for the data source) for each Matomo metric (in this case: Visits) you need to aggregate on.
All new calculated fields will be available as Dimensions, and hence can be aggregated.

