Found a rather strong bug with Custom Reports and the Looker Studio Connector:
This is what the Custom Report reports for June 2024:
| Kanaltyp | Fingerabdruck |
|---|---|
| Suchmaschinen | 23.078 |
| Direkte Zugriffe | 17.933 |
| Webseiten | 2.297 |
| Kampagnen | 1.029 |
| Soziale Netzwerke | 1.111 |
| Gesamtsummen | 45.448 |
And this is what the Looker Studio Connector reports for June 2024, when using “Kanaltyp” as Dimension (also note how “Suchmaschinen” drops to a fraction from what it is in June, while the other months are fine):
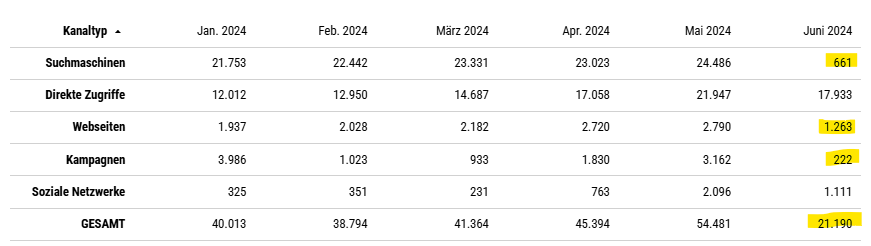
Almost like the Looker Studio Connector cuts of some 50% of the June data in total (and for Search, some 80-90%).
When playing with the report date in Looker Studio, it gets even weirder: The values get realistic levels when setting the date range just slightly lower from Jan 1st 2024 to Jun 24th 2024 instead of to June 30th 2024.
How come?