I do have a problem since I upgraded to 4.15.0. (from 4.13.0 if I correctly remember) I found the following entry Very huge archive_blobs in database but decided to create a new one, because this one was solved with an installable version. And main difference: I can normalize the usage with your commands
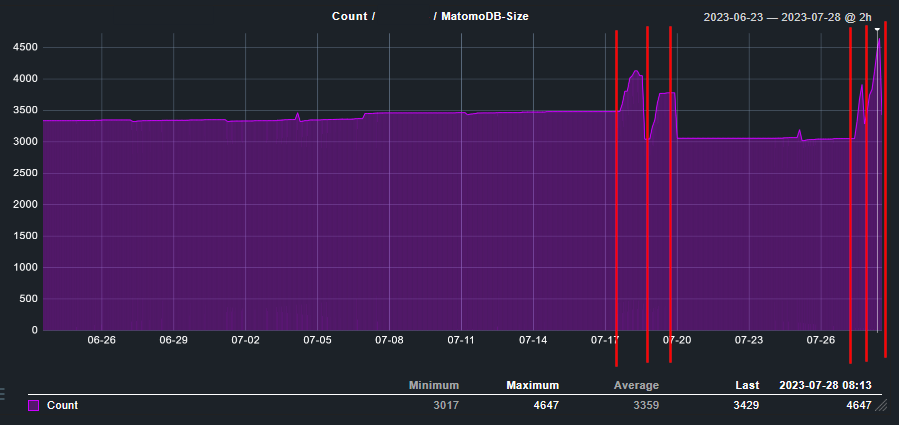
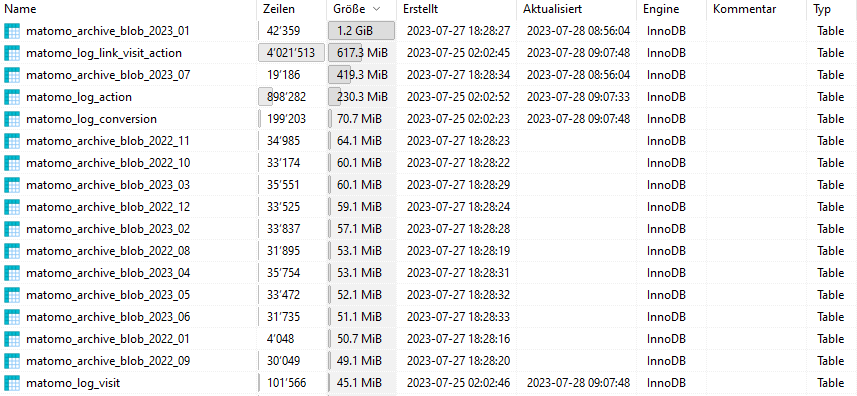
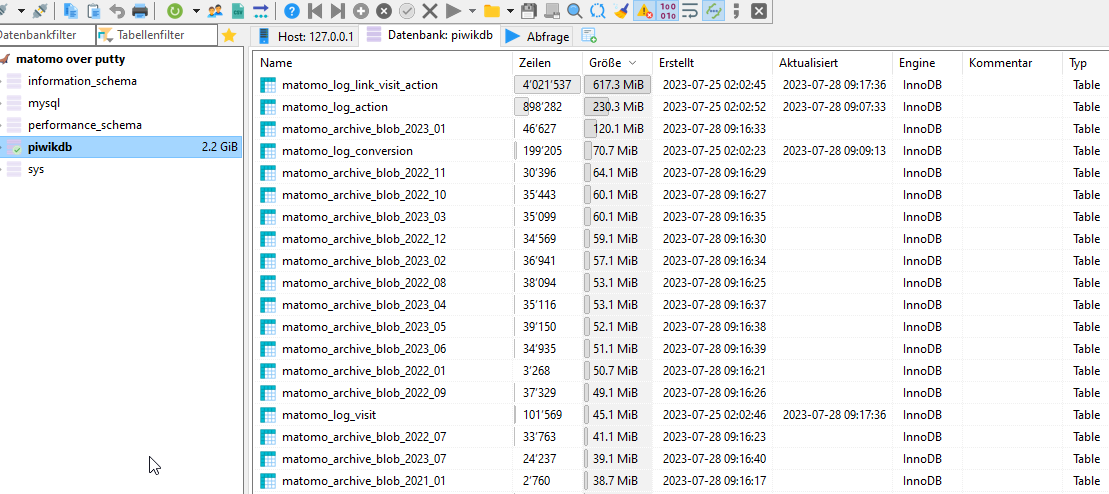
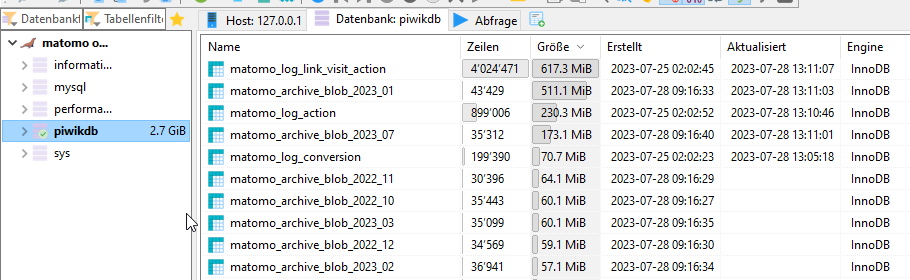
I’ve got the problem, that the archive_blobs newly are getting absolutely out of scope comparing the others and the behaviour before 4.15.0
Interestingely you see completely calm days inbetween.
The normal archive job is runnig
/usr/bin/php81 /var/www/html/console core:archive
Whole DB Size (as you see before: steady increase and then some extreme increases).
The decreases are after manually running /usr/bin/php81/var/www/html/console core:archive --url=http://analytics.scaling.ch/ --force-date-range=2022-12-24,2023-07-17 /usr/bin/php81/var/www/html/console core:purge-old-archive-data all /usr/bin/php81/var/www/html/console database:optimize-archive-tables all
so not with the current date.
I’m very sorry, but what exactly should I check there? The Problem was solved with 3.13.0. I’m on 4.15… as said with 4.13.0 it wasn’t the case.
But give me a hint, if I missed something in that other thread.
I’d be happy to investigate further if you could guide me to the right direction. @karthik
I’m lost im same state… exceptional growing blob tables.
Additionaly it looks like we have a behaviour which stresses our database more and more (can be that the planned cronjobs are too much but don’t think so), so our connections get filled up to the max.
And the DB has to be restarted at some time.
I’m not sure if it’s the same problem source.
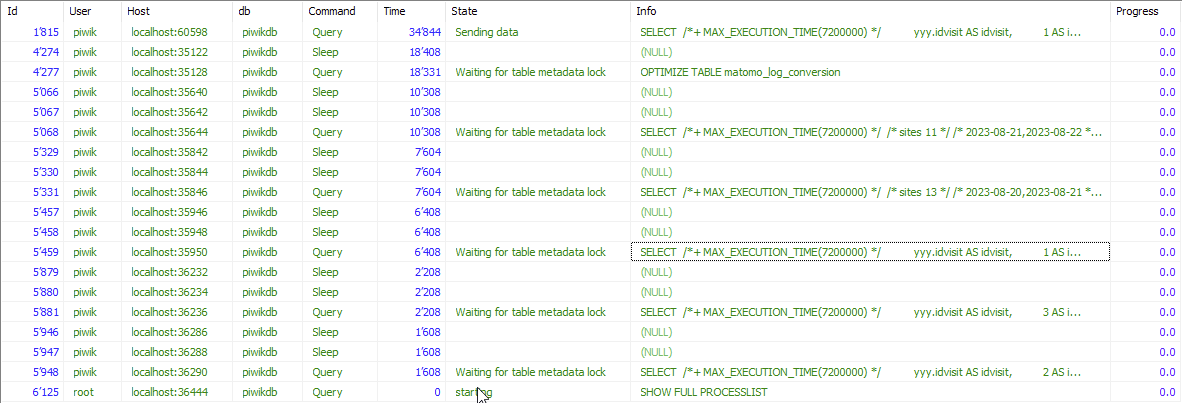
We do have the situation that one process is blocking others.This morning seen again.
Unfortunately I don’t have the complete statement from the toppest entry
Also there is a difference in MAX_EXECUTION_TIME setting
Differences Between the MariaDB and MySQL Implementations
MySQL 5.7.4 introduced similar functionality, but the MariaDB implementation differs in a number of ways.
The MySQL version of max_statement_time (max_execution_time) is defined in millseconds, not seconds
MySQL’s implementation can only kill SELECTs, while MariaDB’s can kill any queries (excluding stored procedures).
MariaDB only introduced the max_statement_time_exceeded status variable, while MySQL also introduced a number of other variables which were not seen as necessary in MariaDB.
The SELECT MAX_STATEMENT_TIME = N ... syntax is not valid in MariaDB. In MariaDB one should use SET STATEMENT MAX_STATEMENT_TIME=N FOR....
After tuning the my.cnf for mariadb (because of the discrepancy to mysql) all looks fine again.
Matomo is using the MAX_EXECUTION_TIME in different settings wich are not working in MariaDB.
If you would investigate further below ist the problematic statement which was aborted today. At least I’m very confident that this is it.
What looks strange for me is that this statement is about
/* 2023-07-26,2023-07-27 */
# Time: 230823  8:55:58
# User@Host: piwik[piwik] @ localhost [127.0.0.1]
# Thread_id: 15485  Schema: piwikdb  QC_hit: No
# Query_time: 1800.000263  Lock_time: 0.000117  Rows_sent: 0  Rows_examined: 1678603565
# Rows_affected: 0  Bytes_sent: 621
SET timestamp=1692773758;
SELECT  /*+ MAX_EXECUTION_TIME(7200000) */
          yyy.idvisit AS idvisit,
          1 AS idgoal,
          1 AS `type`,
          yyy.idaction AS idaction,
          COUNT(*) AS `1`,
          ROUND(SUM(yyy.revenue_total),2) AS `2`,
          COUNT(yyy.idvisit) AS `3`,
          ROUND(SUM(yyy.revenue_subtotal),2) AS `4`,
          ROUND(SUM(yyy.revenue_tax),2) AS `5`,
          ROUND(SUM(yyy.revenue_shipping),2) AS `6`,
          ROUND(SUM(yyy.revenue_discount),2) AS `7`,
          SUM(yyy.items) AS `8`,
          yyy.pages_before AS `9`,
          SUM(yyy.attribution) AS `10`,
          COUNT(*) AS `12`,
          ROUND(SUM(yyy.revenue),2) AS `15`
        FROM (
          SELECT
            num_total AS pages_before,
            1 / num_total AS attribution,
            r.idvisit AS idvisit,
            lac.idaction AS idaction,
            lvcon.revenue AS revenue_total,
            1 / num_total * lvcon.revenue AS revenue,
            1 / num_total * lvcon.revenue_subtotal AS revenue_subtotal,
            1 / num_total * lvcon.revenue_tax AS revenue_tax,
            1 / num_total * lvcon.revenue_shipping AS revenue_shipping,
            1 / num_total * lvcon.revenue_discount AS revenue_discount,
            1 / num_total * lvcon.items AS items
          FROM (
            SELECT /* sites 5 */ /* 2023-07-26,2023-07-27 */ /* Actions */ /* trigger = CronArchive */
                                log_conversion.idvisit, COUNT(*) AS num_total
                        FROM
                                matomo_log_conversion AS log_conversion RIGHT JOIN matomo_log_link_visit_action AS log_vpast ON log_conversion.idvisit = log_vpast.idvisit LEFT JOIN matomo_log_action AS lac_past ON log_vpast.idaction_url = lac_past.idaction
                        WHERE
                                log_conversion.server_time >= '2023-07-26 22:00:00'
                                AND log_conversion.server_time <= '2023-07-27 21:59:59'
                                AND log_conversion.idsite IN ('5')AND log_conversion.idgoal = 1
                          AND log_vpast.server_time <= log_conversion.server_time
                          AND lac_past.type = 1
                        GROUP BY
                                log_conversion.idvisit
          ) AS r
          LEFT JOIN matomo_log_conversion lvcon ON lvcon.idgoal = 1 AND lvcon.idvisit = r.idvisit
          RIGHT JOIN matomo_log_link_visit_action logv ON logv.idvisit = r.idvisit
          LEFT JOIN matomo_log_action lac ON logv.idaction_url = lac.idaction
          WHERE logv.server_time >= '2023-07-26 22:00:00'
            AND logv.server_time <= '2023-07-27 21:59:59'
            AND logv.idsite IN (5)
            AND lac.type = 1
            AND logv.server_time <= lvcon.server_time
          ) AS yyy
        GROUP BY yyy.idaction
        ORDER BY `9` DESC;
# User@Host: piwik[piwik] @ localhost [127.0.0.1]
# Thread_id: 15394  Schema: piwikdb  QC_hit: No
# Query_time: 0.000086  Lock_time: 0.000021  Rows_sent: 12  Rows_examined: 12
# Rows_affected: 0  Bytes_sent: 2763
ET timestamp=1692773758;
SELECT * FROM matomo_site ORDER BY idsite ASC;
# User@Host: piwik[piwik] @ localhost [127.0.0.1]
# Thread_id: 15394  Schema: piwikdb  QC_hit: No
# Query_time: 0.000100  Lock_time: 0.000032  Rows_sent: 0  Rows_examined: 0
# Rows_affected: 0  Bytes_sent: 1247
SET timestamp=1692773758;
SELECT report.*
                                                                FROM matomo_report AS `report`
                                                                        JOIN matomo_site
                                                                        USING (idsite)
                                                                WHERE deleted = 0;
this join creates view with 700000+ records out of
          SELECT *

			FROM
				matomo_log_conversion AS log_conversion RIGHT JOIN matomo_log_link_visit_action AS log_vpast ON log_conversion.idvisit = log_vpast.idvisit LEFT JOIN matomo_log_action AS lac_past ON log_vpast.idaction_url = lac_past.idaction
			WHERE
				log_conversion.server_time >= '2023-07-27 07:20:59'
				AND log_conversion.server_time <= '2023-07-27 07:29:59'
				AND log_conversion.idsite IN ('5');
this join creates view with 700000+ records out of
SELECT * FROM matomo_log_link_visit_action WHERE server_time LIKE '%2023-07-27%' AND idsite IN (5);
SELECT * FROM matomo_log_conversion WHERE server_time LIKE '%2023-07-27%' AND idsite IN (5);
Hi @katamadone
I am not technical expert on such issue.
Maybe @karthik or @innocraft have better clues?
If you get no response, you can try to create a GitHub ticket with a reference to this post.
If you have the problem of huge archive blobs, you can try deleting the historical archives by following the forum post and there is a command mentioned there. Note deleting the archive will impact historical data of newly created and edited reports, however as long as you have raw data you can always reprocess it