This proposed UI feature would allow you to assign notes to given days to help you keep track of changes that may have influenced your traffic, conversions, or otherwise just help you keep tabs on what has been happening with your site over a period of time. This would give a more human element to the data and should assist webmasters in keeping track of traffic or other metric changes and making note of possible correlations.
.
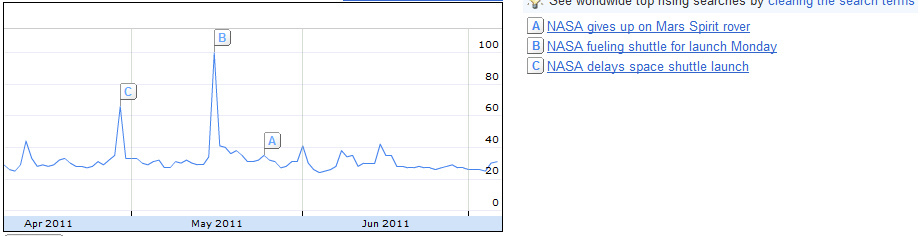
There are many reasons this information could be valuable to keep track of, whether it’s that you added 10 new backlinks on a given day, redid your on-site SEO, received attention from a blogger or major publication, or launched a new product. I really can’t overstate the many benefits and uses this could have. The alternative is to keep tab of things in excel or otherwise, which the vast majority of analytics users don’t or are not inclined to do. An example of a service that showcases data like this is Google Insights for Search, as seen below:
Possible functionality could entail:
*Toggle for show/hide notes in dashboard, or above charts, as well as a “edit notes” button once shown.
*When enabled, notes would appear as small vertical colored flags with a single letter, ordered alphabetically by date.
*Note summary displayed similarly to Google Insights, in an adjacent box or above/below graph, with matching colored flags.
*Hovering over dates would display a lightly colored vertical line until reaching a denoted flag, upon which the color would change and the note would expand above the point.
*Same set of notes would be used globally for all line/bar charts, or as individual sets for visitors, actions, referrers, & goals
*When “edit notes” button is clicked, similar functionality to viewing notes would occur, only with additional buttons to edit/delete note when hovering over active ones, and an add button when hovering over nondenoted dates.
Should there come a time when you can show multiple historical line graphs in the same chart, such as visitors, backlinks with SEOv2, alongside notes, that would be the ultimate in at a glance analysis. Thanks for listening and thanks for making such an awesome analytics system.