Hi I want to be able to set a secondary dimension (that is a custom dimension) on my Matomo dashboard, I tried using chatgpt for the answer, it tell me that I should have a second dimension option when clicking on the gear icon but I don’t have it :
I’ve seen the secondary dimension option missing even when custom dimensions are enabled. It might depend on the report type or configuration, so checking the plugin setup and scope could help.
The lack of a secondary dimension feature can definitely make deep-diving into the data a bit more tedious than it needs to be. I’ve found that while we wait for a native UI update, using the ‘Segmentation’ tool is usually the best workaround.
If you create a segment for the first dimension you’re interested in, you can then view any other report filtered by that criteria, which essentially gives you that ‘secondary’ layer of insight. It’s an extra click or two, but it’s a solid way to get the specific breakdown you need without having to export everything to a spreadsheet.
You’re not missing anything—Matomo (especially SaaS) doesn’t support secondary dimensions in most reports, even with Custom Dimensions enabled.
As a workaround, use Segments: create one for your custom dimension (e.g., Department) and apply it to the page report. It’s not a true secondary dimension, but it gives a similar filtered view.
For a full breakdown (page + department), you’ll likely need a custom report or export the data.
It looks like you’ve run into a common point of confusion with the core Matomo interface. By default, Matomo doesn’t actually have a “Secondary Dimension” button inside standard reports like Google Analytics does.
To see your “Department” custom dimension alongside a specific page, you have two main options:
1. Use the Custom Reports Plugin (Recommended)
Since you are on the Matomo SaaS (Cloud) solution, you already have access to the Custom Reports plugin. This is the “official” way to do what you’re looking for.
Go to Reporting > Custom Reports > Manage.
Create a new report and set the Primary Dimension to “Page URL” and the Secondary Dimension to your “Department” custom dimension.
This will generate a dedicated table showing exactly how those departments are interacting with specific pages.
2. Use “Flatten” and “Segment”
If you don’t want to build a new report:
Open your Pages report.
Click the Segmentation icon at the top and create a segment where “Department is [Name]”.
This filters the entire report to only show that department’s activity. It’s not a side-by-side view, but it works for a quick check.
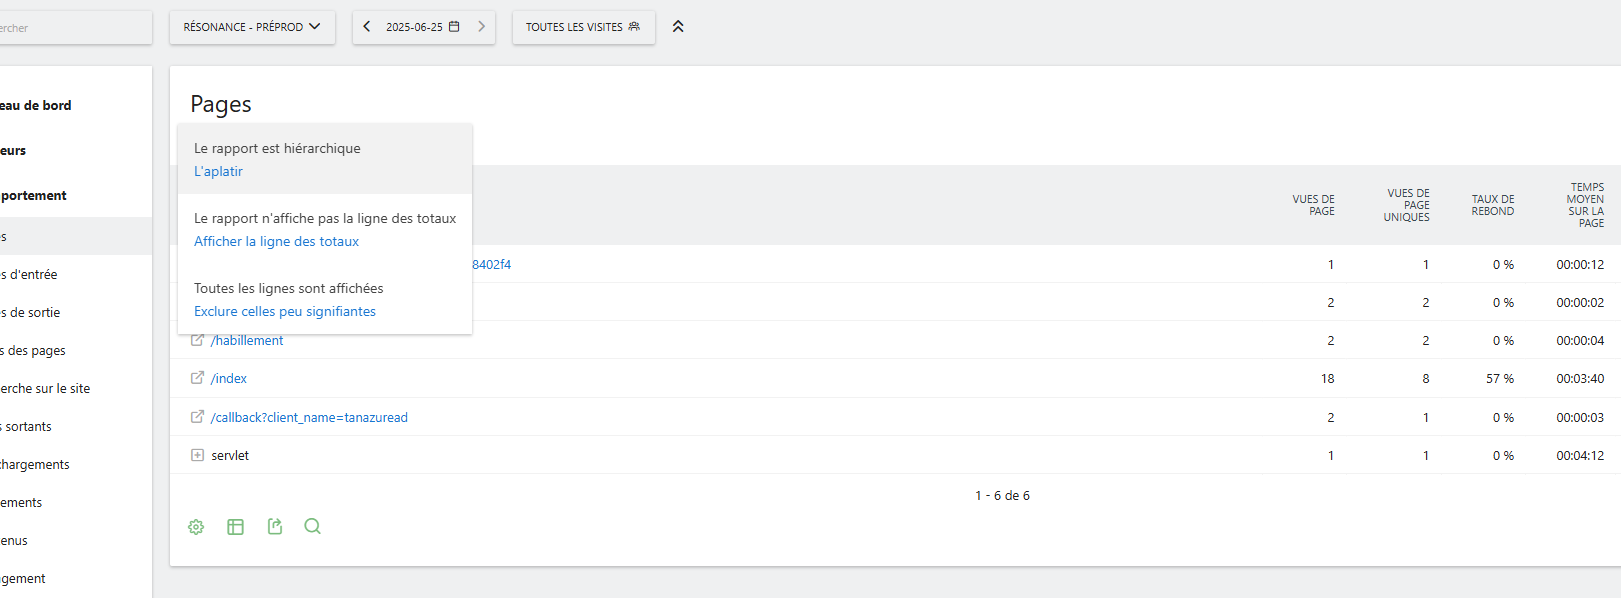
The gear icon menu in your screenshot only controls display settings (like flattening or hiding rows), which is why you aren’t seeing any dimension options there. Stick with the Custom Reports tool it’s much more powerful for what you need.