weiyi1000
(weiyi1000)
1
Hi all:
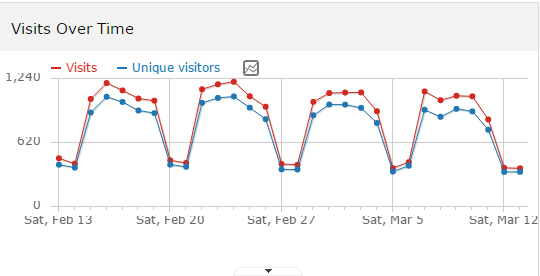
I wonder if the metric in the graph can be plot in two graph.
For example,in visits over time widget,I have two metrics that are Visits and Unique visitors.the default graph is like this
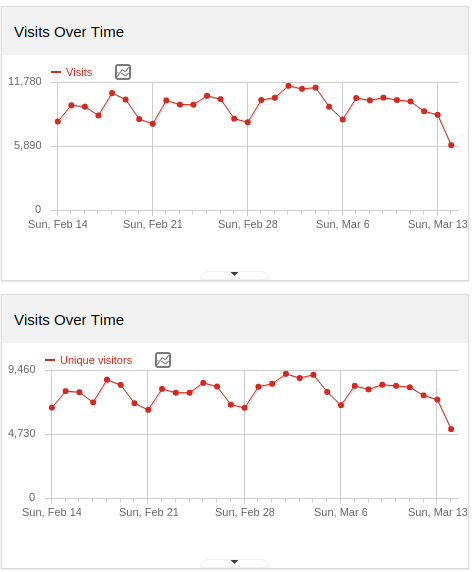
but I need to make two graph to plot Visits and Unique visitors separately.
I can’t make that both appear in the same dashboard.Is there any way to do that? I searched the piwik doc but didn’t find the answer.
This is my first time to ask question in English, excuse my poor English. 
arvi89
(Arvi LEFEVRE)
2
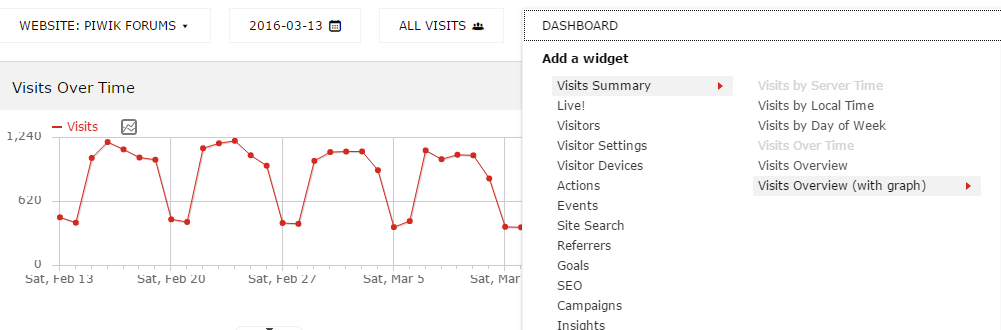
You can make both appear on the dashboard, look:
It works perfectly.
weiyi1000
(weiyi1000)
3
Thanks for your answer!
But when I add a another new Visits Over Time widget the icon will be grey like that
quba
(Kuba Bomba)
4
@weiyi1000 it’s grey but it’s possible to add another widget.
weiyi1000
(weiyi1000)
5
Thank you!
I found that the grey icon can not be clicked but the widget preview below can be clicked to add the widget.
I used to click that icon so it puzzled me.