Piwik is Slowing Down My Website Load Speed... But Why?

Hi there, I have recently been getting serious about improving the speed of my website. I’ve done several things, including using Cloudflare, but mainly reducing graphics on the page.

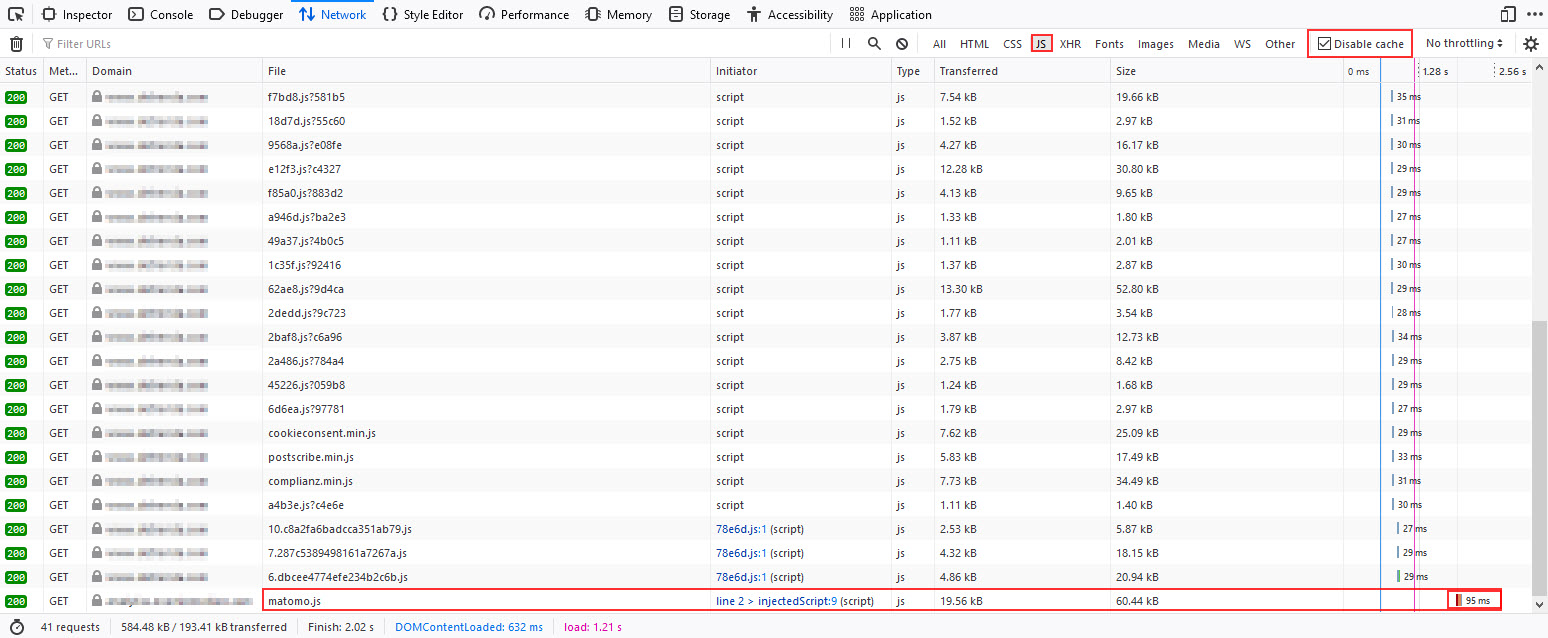
I recently ran an in-depth website speed test (the cascade type) and sorted the elements according to load time. I was surprised to see that the one item that took the longest to load was related to Piwik. It wasn’t any of the graphics on my page, not the css or any javascript or widgets, but Piwik.

I don’t know which component of Piwik it is, exactly, which is why I’m here. I don’t know how to interpret what this means. (This is the report from the speed test):


529Bytes

http://www.example.com/piwik/piwik.php?action_name=Domain%20Name%20Page%20Title&idsite=1&rec=1&r=234824&h=5&m=1&s=24&url=http%3A%2F%2Fwww.example.com%2F&_id=b6c7a17963c6a9bd&_idts=1428980485&_idvc=1&_idn=1&_refts=0&_viewts=1428980485&pdf=1&qt=0&realp=0&wma=0&dir=0&fla=1&java=1&gears=0&ag=0&cookie=1&res=1280x1024&gt_ms=1465


[b]Response Headers[/b]
200

    Pragma no-cache
    Date Tue, 14 Apr 2015 03:01:26 GMT
    Content-Encoding gzip
    Server cloudflare-nginx
    X-Powered-By PHP/5.4.27
    Vary Accept-Encoding,User-Agent
    Content-Type image/gif
    Set-Cookie PIWIK_SESSID=86dc1594e702cddc19e5afff6a69b0b0; path=/; HttpOnly
    Cache-Control no-store, no-cache, must-revalidate, post-check=0, pre-check=0
    Connection keep-alive
    CF-RAY 1d6c2a7fdf161834-EWR
    Content-Length 50
    Expires Thu, 19 Nov 1981 08:52:00 GMT


[b]Request Headers[/b]

    Pragma no-cache
    Accept-Encoding gzip, deflate, sdch
    Host www.example.com
    Accept-Language en-US,en;q=0.8
    User-Agent Mozilla/5.0 (X11; Linux x86_64) AppleWebKit/537.36 (KHTML, like Gecko) Chrome/39.0.2171.95 Safari/537.36
    Accept image/webp,*/*;q=0.8
    Referer http://www.example.com/
    Cookie __cfduid=d04406582980e75c8ef75d8b4472b3ba41428980481; has_js=1; _pk_id.1.bff6=b6c7a17963c6a9bd.1428980485.1.1428980485.1428980485.; _pk_ses.1.bff6=*
    Connection keep-alive
    Cache-Control no-cache


So then, I temporarily disabled Piwik on my site, and ran the website speed test again. This time, the website loaded in half the time, an improvement of almost 2 seconds!! (It went from 4.25 seconds down to 2.4 seconds, which is a huge improvement).

Finally, The “529 Bytes” element seems to be a very small image (gif) that looks like a small white dot. (I clicked on the link in the website speed test and the small image loaded).

Is there anything I can do to “fix” this? I wish I had run the detailed test prior to using Cloudflare, so I could eliminate that possibility, but it is what it is.

According to Cloudflare’s site, using Cloudflare can interfere with 3rd party analytics, so you are supposed to install “mod_cloudflare” in Apache, which I have… not sure if this is good or bad. mod_cloudflare is supposed to let your 3rd party analytics see the visitors’ real IP address (instead of only seeing Cloudflare’s servers’ IP addresses).

I desperately needed to improve my website’s speed, so I am encouraged the speed nearly doubled, but at the expense of disabling Piwik analytics :frowning:

Any ideas? Thanks.

1 Like

Any ideas?

Having the same problem myself :frowning:

Would like to read explanation from team Piwik on this.

Hi there,

it’s possible the speed testing tool will think Piwik makes the website slow but as far as we know, the Piwik JS code is executed asynchronously which means the browser does not wait for Piwik to render the website. So the user visiting the site will not feel those extra two seconds of waiting. If you find that this is not true for some reasons, I’d love to hear more details.

(The 1*1 gif is the response from Tracking API. In modern Piwik we’ve even removed this pixel and now it just returns an empty response https status code 204 )

Thanks for the reply. Setting up APC on my box, really seems to have helped:

https://forum.linode.com/viewtopic.php?t=8160

Gone from 1.5 secs, to just 200ms now. Thanks :slight_smile:

Andy & Matt, thanks for the replies.

Matt, good point about how browsers vs. website speed testers would interpret things. I will look into this further.

Andy, by “APC” do you mean Alternative PHP Cache? Do you think enabling APC fixed the Piwik “problem” I mentioned, or did APC speed up everything about your website?

Andy, by “APC” do you mean Alternative PHP Cache? Do you think enabling APC fixed the Piwik “problem” I mentioned, or did APC speed up everything about your website?

For me, it did a bit of both (as I’m using WP)

@matt: you’re right that piwik is not slowing down DOMContentLoaded, i.e. the time until the page becomes usable. However, it is slowing down the time until window.onload, i.e. it looks to the user like the page needs a longer time to load because of the browser’s loading indicator.

Generally, the technique used by the piwik snippet is no longer recommended. Please see Script-injected "async scripts" considered harmful - igvita.com for details. And in fact, following the recommendation from that article by putting the following into the :


  <script>
    var _paq = _paq || [];
    _paq.push(['trackPageView']);
    _paq.push(['enableLinkTracking']);
    _paq.push(['setTrackerUrl', '//mysite/piwik/piwik.php']);
    _paq.push(['setSiteId', 1]);
  </script>
  <script src="//mysite/piwik/piwik.js" async></script>

improves the overall page loading performance compared to the official piwik snippet right before .

However, since piwik is purely optional and not required for the page to work, we can do even better with this slight modification of the piwik snippet:


  <script>
    var _paq = _paq || [];
    _paq.push(['trackPageView']);
    _paq.push(['enableLinkTracking']);
    window.addEventListener('load', function() {
      var u="//mysite/piwik/";
      _paq.push(['setTrackerUrl', u+'piwik.php']);
      _paq.push(['setSiteId', 1]);
      var d=document, g=d.createElement('script'), s=d.getElementsByTagName('script')[0];
      g.type='text/javascript'; g.async=true; g.defer=true; g.src=u+'piwik.js'; s.parentNode.insertBefore(g,s);
    });
  </script>

right before (needs more work if you care about older IEs). While this loads piwik even later and has therefore a higher chance of missing stats, it doesn’t delay the onload and therefore does not give the impression of slowing down the loading.

2 Likes

Hi there,

thanks for your suggestions. Since this is very technical and may need product change, could you please create an issue in: Issues · matomo-org/piwik · GitHub

we will follow up there!

That:


window.addEventListener('load', function() {
...
}

…tweak seems to knock about .2 seconds off for me. So could well be worth investigating as part of the core.

Cheers

Andy

@pekeler: Thank you so much for this optimized snippet! :smiley:
My page display was always waiting for the piwik script to be loaded and slowed down the page view dramatically as the reaction time of piwik always takes a bit longer on my server (and I have everything possible done to improve it).

window.addEventListener('load', function() {
-> this is / was the key for me

Thumbs up! :+1: :beers:

@pekeler Google recommends this for your snippet modification:

Only use this tracking snippet if your visitors primarily use modern browsers to access your site.

Hey guys, sorry to bump this old thread, but I not smart, am still experiencing this issue in 2020, and this seems to be the best thread available (still).
Anyway I would like to implement these optimizations but don’t know enough to be able tell what is current, and if they are, how to apply them. If someone could put a variation or 2 in context of the whole tracking code piece I would love you forever :grimacing:.

To anyone struggling to speed up the matomo.js file.

Have Cloudflare serve the file.

Without a cdn, it is impossible for me to get that kind of speed and I’ve been at it for about a couple days now, tried things to my ability.

I’m happy with under 100ms for matomo.js to load on first view.

For website config:

Website:
OpenLiteSpeed server with LSCache - (nginx is similar)
php 7.4
Any cdn will do.

Matomo:
on external subdomain
OpenLiteSpeed php 7.4
cdn by cloudflare.

Also very important on the website cdn you must somehow put matomo on the bypass any security checks - a direct line so to speak.
https://www.screencast.com/t/Bx1Qb3jP9

That made a huge difference even before putting Matomo on cloudflare.
If I remember right, from 5-6xx ms down to 2xx ms.

Got to say tho. I don’t have many plugins installed in Matomo, just a few for more detailed analytics, no heat map etc.

Hope this help :wink: Good luck.

Hi @m_mato,

Just keep in mind that plugin updates and Matomo updates can change the matomo.js, so keep in mind that you probably need to invalidate your cache then (or not have such a long caching period).

You could also look into this plugin:

https://plugins.matomo.org/TrackerJsCdnSync

1 Like

Thanks for the into, you are right.
Does the plugin work with cf?

I’ve read the github thread and understand it only work with AwsS3 and BunnyCdn.
I’ll put a shorter caching period, seems best option for a non-technical person like me.

You are right, the plugin doesn’t (yet) support Cloudflare.

I’ve opened an issue: https://github.com/SARAVANA1501/plugin-TrackerJsCdnSync/issues/9

Hopefully we’ll get cf supported in future.