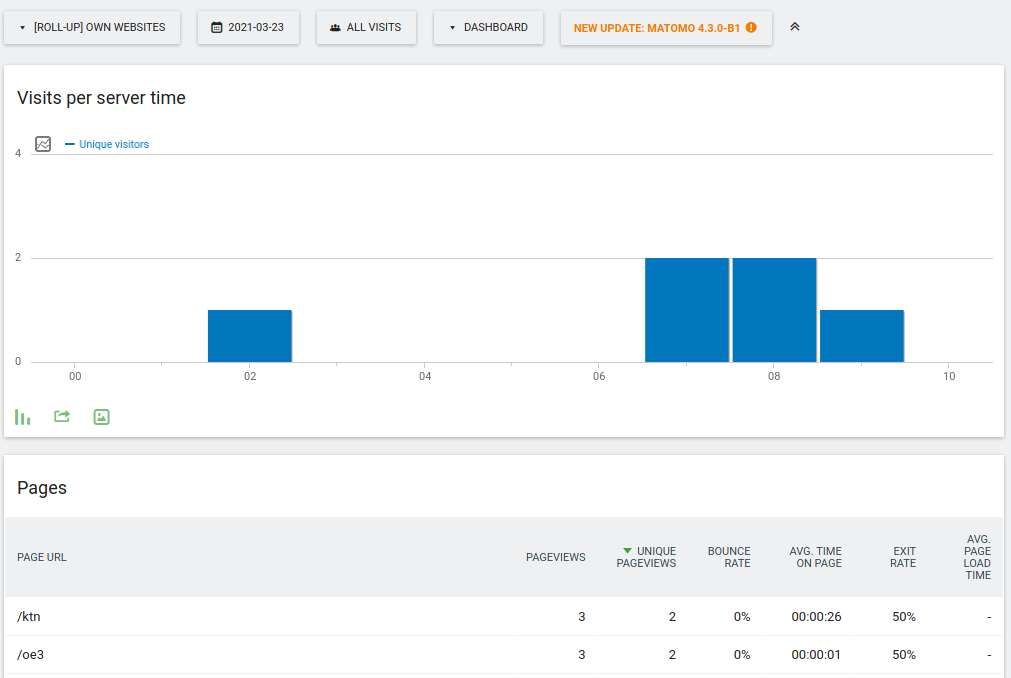
We have an On-Premise Setup of Matomo - We have a requirement that EVREY registered Website on Matomo Dashboard displays graph with Pageviews by hour, total pageviews, and then top pages of the day and their pageviews at the bottom
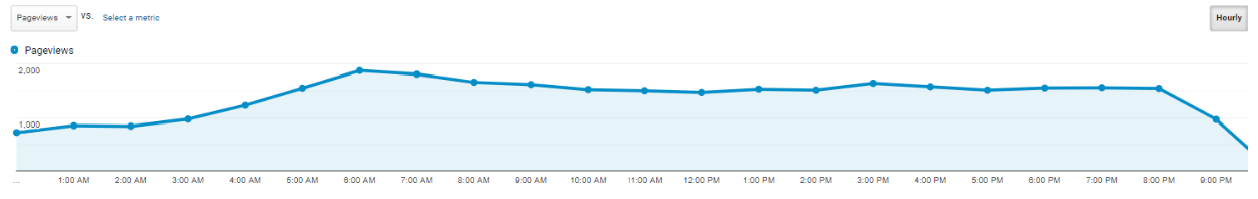
Is it possible to create a Report that splits the Total Page Views by the hour for the last 24 hours ?
My queries around the same :
Is it possible by creating a Custom Plugin / Widget versus purchasing one ?
If # 1 is not possible - is it possible to achieve the same using Custom reports Commercial Plugin ?
I need a way where I do not want to invest in a Custom Reports plugin just to have a COUPLE of reports ? Can you suggest me a workaround of how can the above mentioned REPORTS be achieved with a GRAPH using custom implementation
Thanks for your time and response. I appreciate it. They are part of my Dashboard but they can be shown at the least by a 24 hour Page View. I want to see HOURLY break up within a day in the below graph. How can that be made possible ? Or rather is it even possible to view an HOURLY split within a day ?
Also with the Pages Report - Report does not show a GRAPHICAL representation. Can we add a graphical representation without an extra effort ? Or would it be a feature request ?
Ah,
I get what you mean, but I don’t think this is possible with Matomo out of the box (reports are always created at least per days.
It might be possible with custom reports, but I don’t know for sure.
Sure, Thanks for the prompt response. So we cannot do some development in order to achieve the hourly thing ? We have to go in for the commercial one - Custom Reports ?
Right ! But if I have to create one plugin myself from scratch does the API support an HOURLY split ?
I see periods as DAY(least). If the API has no support for HOURS in a day, I will not be able to query even if I wish to write my own plugin consuming these API’s to achieve an hourly split within a day right ? I just want to confirm this as I am into this just a couple of days back. Thanks !