It’d be great if vistors charts over a long period (1y, 2 years or even more) could be available on a daily granularity.
Actually the upper chart from Matomo, but with daily graphs like in the 2nd chart.
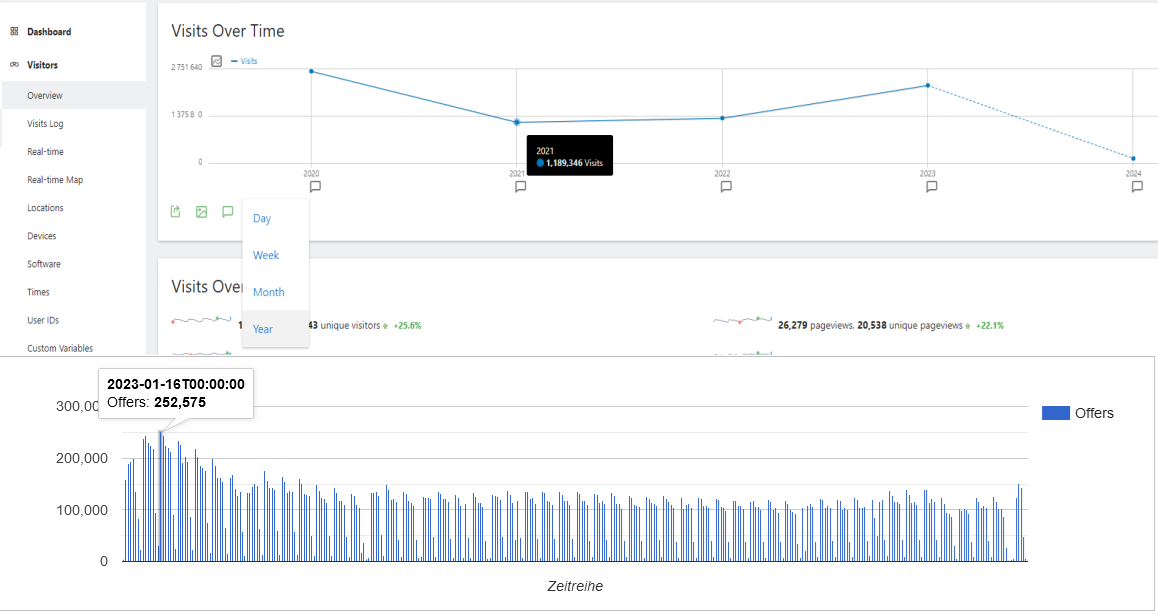
This would help a lot to detect activity patterns and traffic peaks over a long period of time.