Y_Tanaka
October 4, 2018, 5:36am
1
Hello,
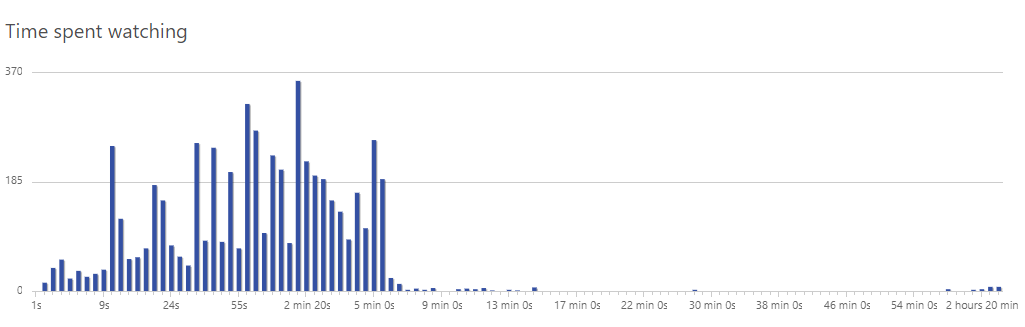
I have been using Matomo x Media Analytics plugin to use media insights. I want to integrate the Media details information which are “Time spent watching” with bar chart into our service.
Here is an detail article including the time spend watching info.https://matomo.org/blog/2017/02/media-analytics-piwik-gives-insights-need-measure-effective-video-audio-marketing-part-2/
So is there any ways to get the data or bar chart from API as export feature?
Thanks.
Hi,
Yes, you can use ImageGraph Metadata: API Reference - Matomo Analytics (formerly Piwik Analytics) - Developer Docs - v3
Along with the Media Analytics module Reporting API Reference: API Reference - Matomo Analytics (formerly Piwik Analytics) - Developer Docs - v3 specifying the sum_total_time_watched column.
An example could be:
https://example.com/index.php?module=API&method=ImageGraph.get&idSite=1&apiModule=MediaAnalytics&apiAction=get&token_auth=xyz&graphType=verticalBar&period=month&date=last10&width=500&height=250&columns=sum_total_time_watched
Y_Tanaka
October 10, 2018, 9:12am
3
Hi,
Thanks for your response.
Sorry for the lack of information.
Actually, we would like to use the MediaAnalytics plugin to generate a chart that displays the number of users who left the video at time=n seconds. I think we need to use the media_spent_time segment in order to do that.
We would like to get data from the API to generate a graph similar to the ‘Time spent watching’ graph created by this url:
http://mydomain.com/index.php?module=CoreHome&action=index&idSite=1&period=day&date=yesterday&updated=1#?idSite=6&period=range&date=2018-08-01,2018-10-09&category=MediaAnalytics_Media&subcategory=MediaAnalytics_TypeVideo&popover=RowAction$3AMediaDetails$3AgetVideoTitles$3A66$3A$257B$257D
We need to generate charts in our CMS by getting data from the API.
We need accurate data and if possible we would like to avoid to use time ranges like segment=media_spent_time>0;media_spent_time<7
Currently, we use this command, but we would like to reduce the number of calls to the API.
curl -X GET "https://mydomain.com/index.php?\
period=range&date=2018-01-01,2018-10-01&\
module=API&\
segment=media_spent_time==35;media_title==dummy_video\
&idSite=1&\
method=MediaAnalytics.getVideoTitles&format=JSON&\
token_auth=xyz" -v | python -m json.tool
As our videos are about 10 minutes long, we can’t call the API 600 times…
Any help would be highly appreciated.
Thanks
Can you confirm the type of graph you would like is similar to below?
Y_Tanaka
October 15, 2018, 10:40am
5
Hi,
Thanks for your response.
Yes, the graph is what we want to get.
Regards,
Y_Tanaka
November 6, 2018, 5:51am
6
Hi,
Is there any way to get the each range of data from API for the chart?
Thanks.
Y_Tanaka
December 19, 2018, 1:41am
8
Hi Jason,
Sorry for the delay response.
The API url you gave me was I was looking for. It worked fine on our environment. It will be able to customize our chart using it.
Thanks so much.
Regards,
1 Like