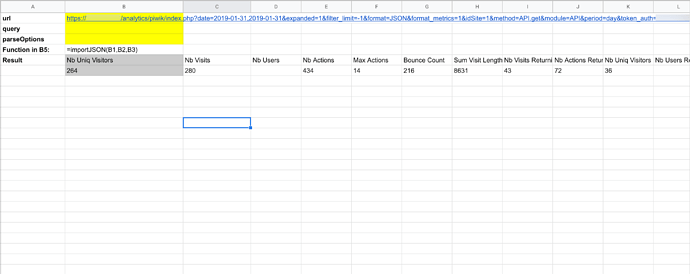
I’m trying to work with Google Sheets to import JSON from the Matomo API like so:
https://example.com/analytics/piwik/index.php?date=2018-04-03,2019-01-31&expanded=1&filter_limit=-1&format=JSON&format_metrics=1&idSite=1&method=API.get&module=API&period=day&token_auth=example
When I spin up the query for more than one day, it generates thousands of columns for every metric by day. Ideally, it would have a single column for each metric and a single row for each day.
Is there a mechanism for this in the API?
Hi,
did you ever solve this? I have the same problem. The problem seems not to appear when using XML.
This is the relevant part of my API call:
...&period=month&date=2019-10-01,2019-11-30&format=json
which gives
{
    "2019-10": [
        {
            ...
        }
    ],
    "2019-11": [
        {
            ...
        }
    ]
}
Same call but XML:
...&period=month&date=2019-10-01,2019-11-30&format=xml
gives
<?xml version="1.0" encoding="utf-8" ?>
<results>
	<result date="2019-10">
		<row>
			...
		</row>
	</result>
	<result date="2019-11">
		<row>
			...
		</row>
	</result>
</results>
So obviosly the month filed has a name (“date”) which is not the case in the JSON output.
Unfortunately I can not use XML. Any solution for that?
