I am delighted to announce the launch of the Looker Studio Connector for Matomo, a significant milestone in our journey towards letting you own your data and connect it to your existing tools for better reporting & decision making.
What’s New?
This connector bridges Matomo and Looker Studio, providing a seamless way to export, visualise, and delve into your analytics data, reports, and KPIs within Looker Studio. While our Matomo Dashboards (more info here) are robust and versatile, integrating Matomo KPIs into Looker Studio offers additional benefits, especially if your team is already using Looker Studio internally.
Key Advantages:
- Simplified Integration: Easily connect your Matomo account with Looker Studio and start transforming your data into actionable insights.
- Customised and Enhanced Reporting: Combine the customisation of Looker Studio with our detailed analytics to create powerful, visually compelling reports. This fusion enables not just tailored reporting to your needs but also presents your data in an engaging, intuitive format.
- Real-time Data and Insights: Keep a pulse on your performance metrics with real-time updates, facilitating dynamic decision-making.
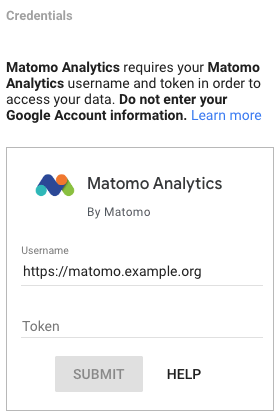
Getting Started:
To help you integrate this feature smoothly, we have prepared comprehensive guides and documentation, available on our website at https://matomo.org/looker-studio
We Value Your Feedback:
Your experience and insights are invaluable to us. We encourage you to share your feedback on the Looker Studio Connector, helping us to continually evolve and tailor our services to your needs. Please create new forum posts here with any questions or feedback.
Thank you for being an integral part of our community. We are excited to see how this new connector enhances your experience with Matomo.