Greatly appreciate the help!
I did the following.
Once the page reloaded
- “Visits Over Time” -> “Metrics to plot” - > CHECKED “Visits”,“Users”,“Pageviews”
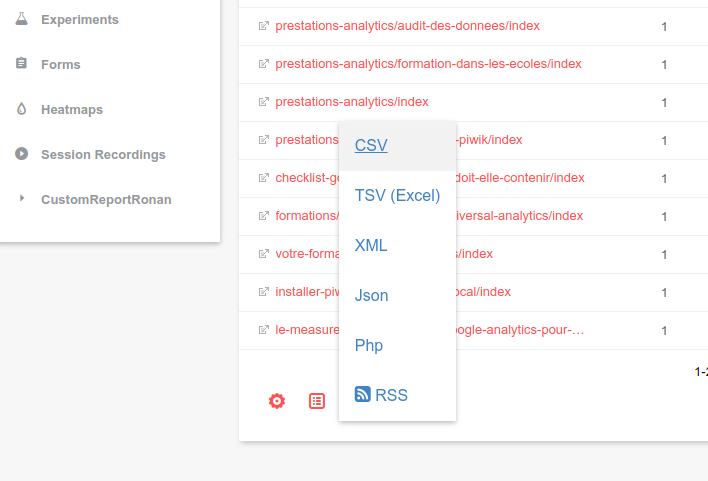
- “Export to CSV”
But the data was still the same high level stuff. CSV contents below.
Date,Visits,Actions,Maximum actions in one visit,Bounces,Total time spent by visitors (in seconds),Returning Visits,Actions by Returning Visits,Maximum actions in one returning visit,Bounce Rate for Returning Visits,Avg. Actions per Returning Visit,Avg. Duration of a Returning Visit (in sec),Conversions,Visits with Conversions,Revenue,Conversion Rate,nb_conversions_new_visit,nb_visits_converted_new_visit,revenue_new_visit,conversion_rate_new_visit,nb_conversions_returning_visit,nb_visits_converted_returning_visit,revenue_returning_visit,conversion_rate_returning_visit,Pageviews,Unique Pageviews,Downloads,Unique Downloads,Outlinks,Unique Outlinks,Searches,Unique Keywords,nb_hits_with_time_generation,Avg. generation time,Bounce Rate,Actions per Visit,Avg. Visit Duration (in seconds)
2017,158,2273,187,2,179693,153,2203,187,1%,14.4,19 min 27s,2,2,0,1.27%,1,1,0,20%,1,1,0,0.65%,481,158,0,0,0,0,0,0,481,0.08s,1%,14.4,18 min 57s

 I hardly ever open a topic, I think you can mark one of your answer as the solution within the icons like the heart, the link, the flag etc