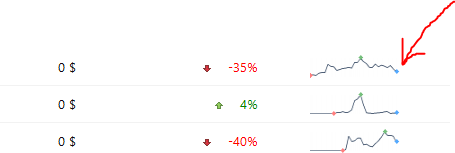
Is there any way to generate the graph image shown in the all website display (see image below) using the api? I would like to generate these graphs and copy them to another server.
I have a site overview display with 50+ sites which means that generating javascript graphs for each site will be too heavy on the browser. I must also be economical with space which means that the generated graph using the api creates a graph which is a bit of an eyesore.
I can’t guarantee it still works but it is definitly worth a try.
BTW: The Sparklines are the oldest part of Matomo and for one of the next releases (maybe 3.5.0) I’m working on modernizing their style and making them higher resolution
PS: If you don’t like the colors of the sparkline, you can write a really simple theme to change it: