I am a newbie here.
I need know how many time a specific event category and action was triggered in a day.
I thought of using the evolution chart. But the only metric I see is the total events.
This metric will count all the events present in the filtered visitor log. How do choose only specific events from the log that match the filter?
Hi @prasad_th,
First way to see the number of triggered events for a day
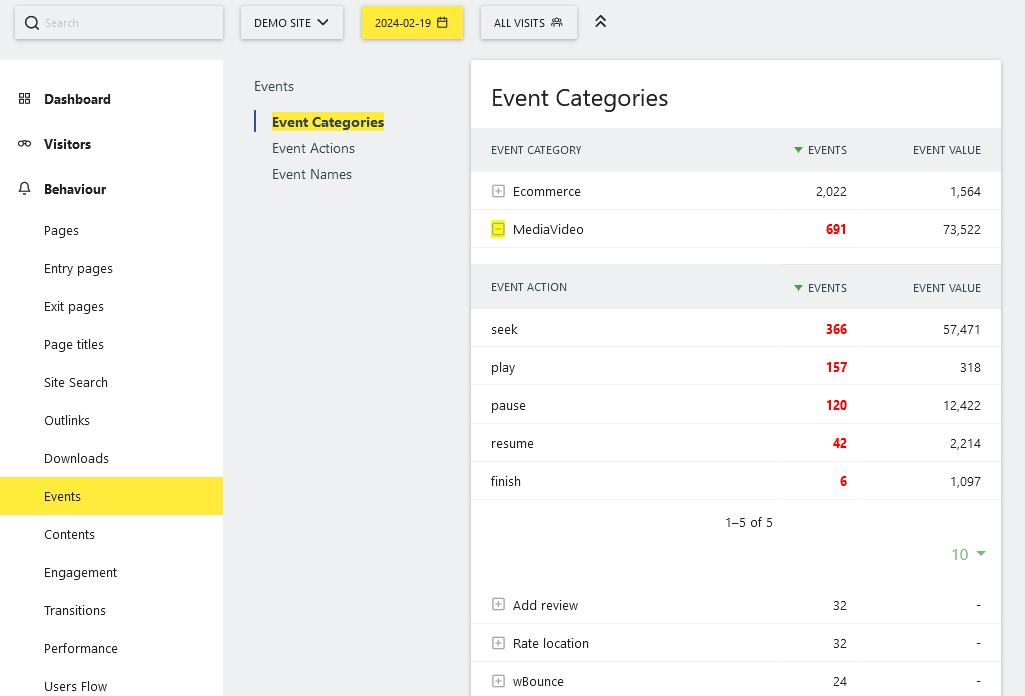
Second way
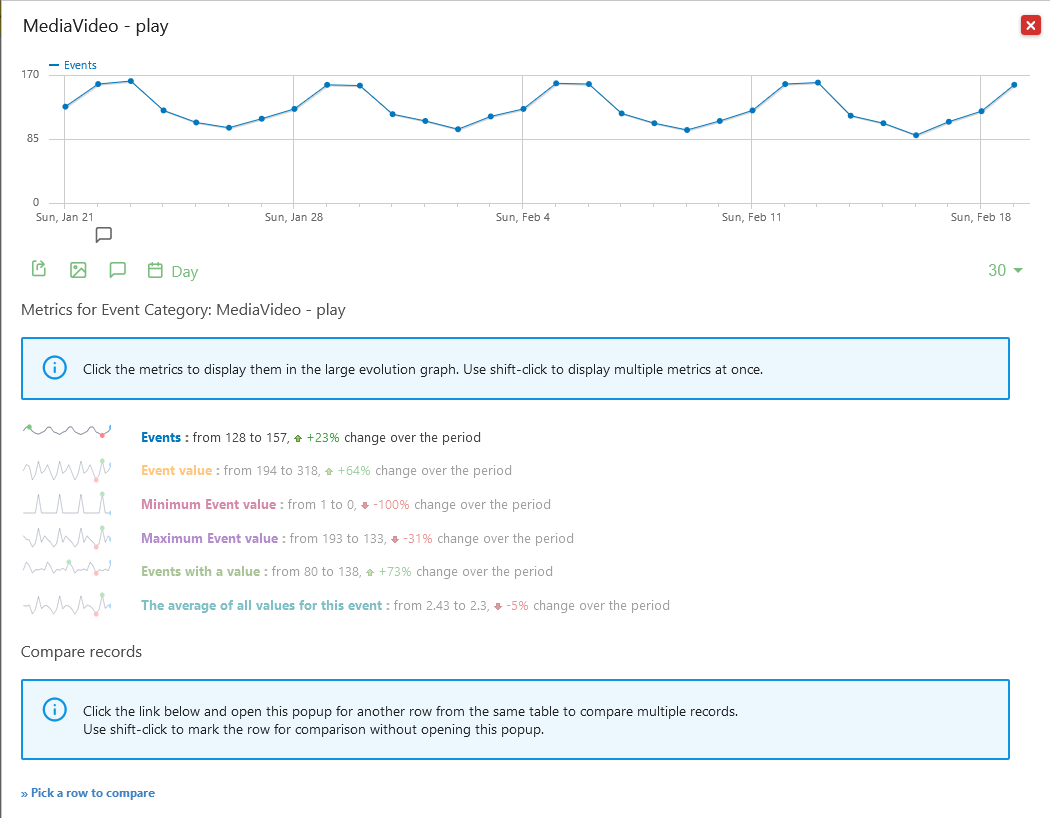
Still on the same page, hover the row:
![]()
then click on ![]() icon:
icon:
Last way
Still on the events page, you can download data thanks to the ![]() icon that appears on the bottom of the table when hovering the table footer…
icon that appears on the bottom of the table when hovering the table footer…
Example page:
1 Like
Hi @heurteph-ei thanks for your response. I like the 2nd choice. But I wasn’t able to figure out how to put it my dashboard for quick access. Is it possible ?
1 Like
Hi @prasad_th
Unfortunately, I don’t think this is possible… ![]()
1 Like
That’s sad. I think I will go with method 3 and use the APIs to make my own dashboard outside matomo. Thanks for help @heurteph-ei
1 Like