Hello, I have failed to find an answer to why a “custom report” dashboard and “behavior / events” report different numbers for the same event. Can anybody help explain?
It is data for the same date and same pages.
Hello, I have failed to find an answer to why a “custom report” dashboard and “behavior / events” report different numbers for the same event. Can anybody help explain?
It is data for the same date and same pages.
Hi!
I have a theory for this because I have a similar problem concerning goals, although I can’t confirm that thought with 100% certainty.
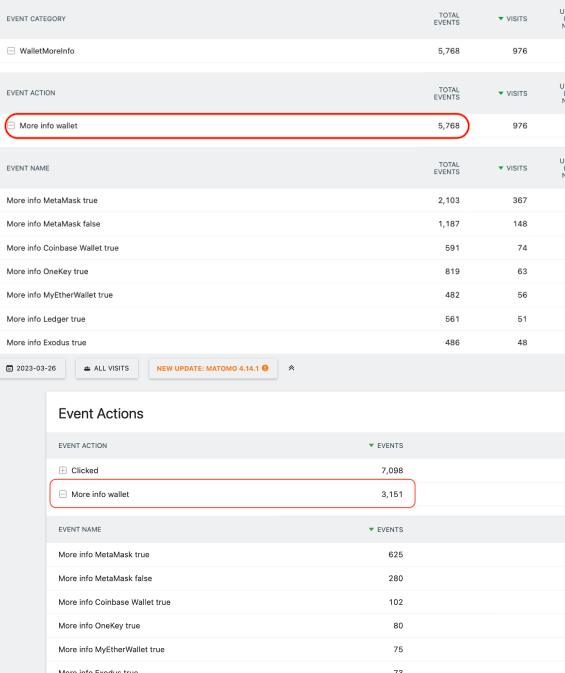
The upper report is the custom report right? As far as I understand, the dimensions in a custom report work like a segment that filters visits. So the right way to interpret the custom report would be: “For all the visits that triggered the event action “More info wallet” there were a total of 5.768 Events”. So if a user triggered the event “More info wallet” but also triggered for example an event with the action “Clicked”, this event will also be counted in the Total Events, since this report shows how many events were triggered in total by users that also triggered the event “More info wallet”. I hope this kinda makes sense to you and someone can confirm this theory.
So I guess for your use case (I assume you want to know how often the “More Info Wallet” was triggered) the default event report shows the right data for the single events, if I am correct.
Hello Florian and thank you for the answer - i really do hope someone confirms or sheds some light on this :).
A follow-up question:
If I use “Behavior/Events” section I see all events on the domain (we track a lot), so I assume I have to use a “visitor segment” feature to filter for a specific page. How do I do that?
Using “pageURL contains” I can still see events from other pages and furthermore, the event data for the target page does not equal to data in “all visitors” ![]()
The segment only filter the users. So if you have a segment that is configured like this “page contains = x” it will show you all the data of users that visited the page x but shows the whole visit. That’s why you still see events from other pages because the data of the visited pages before and after page x are also included.
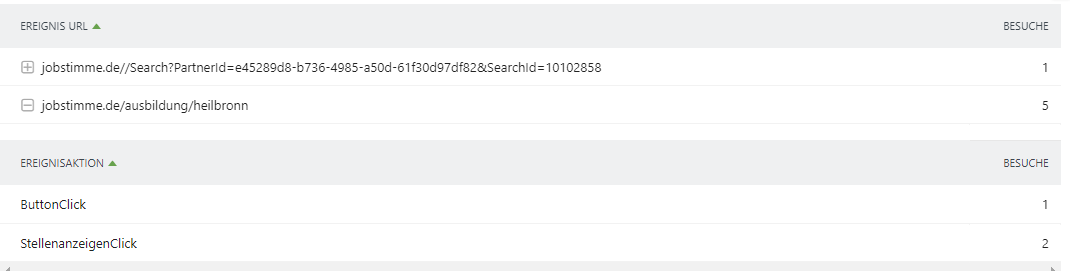
The only way I found for finding out how many events (or goals for that matter) were triggered on a specific page is by a custom report with the dimensions “event-url” and “event-action” and visits as the metric (you can also use “event-name” or “event category”, whatever suits you best).
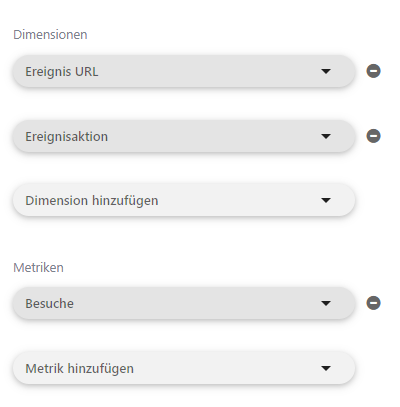
It will show you the data like this:
I think this can be interpreted like this: “The event “ButtonClick” was triggered on 1 visit (in this example) on the specific page x”
Maybe you can try this and see if your data makes sense.
So there is a way to see all triggered events per page using custom reports without having the data being inflated by the whole visit session.
This approach however doesnt seem suitable for our needs as matomo only allows us to select 3 dimensions and I need to see all 3 level of event tracking (category, action, name)
Hi @Asbe, @Florian_Rebmann,
Very strange that the custom report shows more More info wallet events actions than the Event actions report itself. As this concerns premium plugin, I let @innocraft give some clues about this behavior…
Segments are used to filter visits, not actions. Then if a visit has passed through the defined URL, the segment will count all events on all pages of this visit. The only way to define filter on pages, is the use of custom report. In their definition, you can define a filter.
Yes, that’s right!
Another way could also query directly the database:
https://developer.matomo.org/guides/database-schema
Hi @Asbe ,
Can you please get in touch with our support team at shop@matomo.org