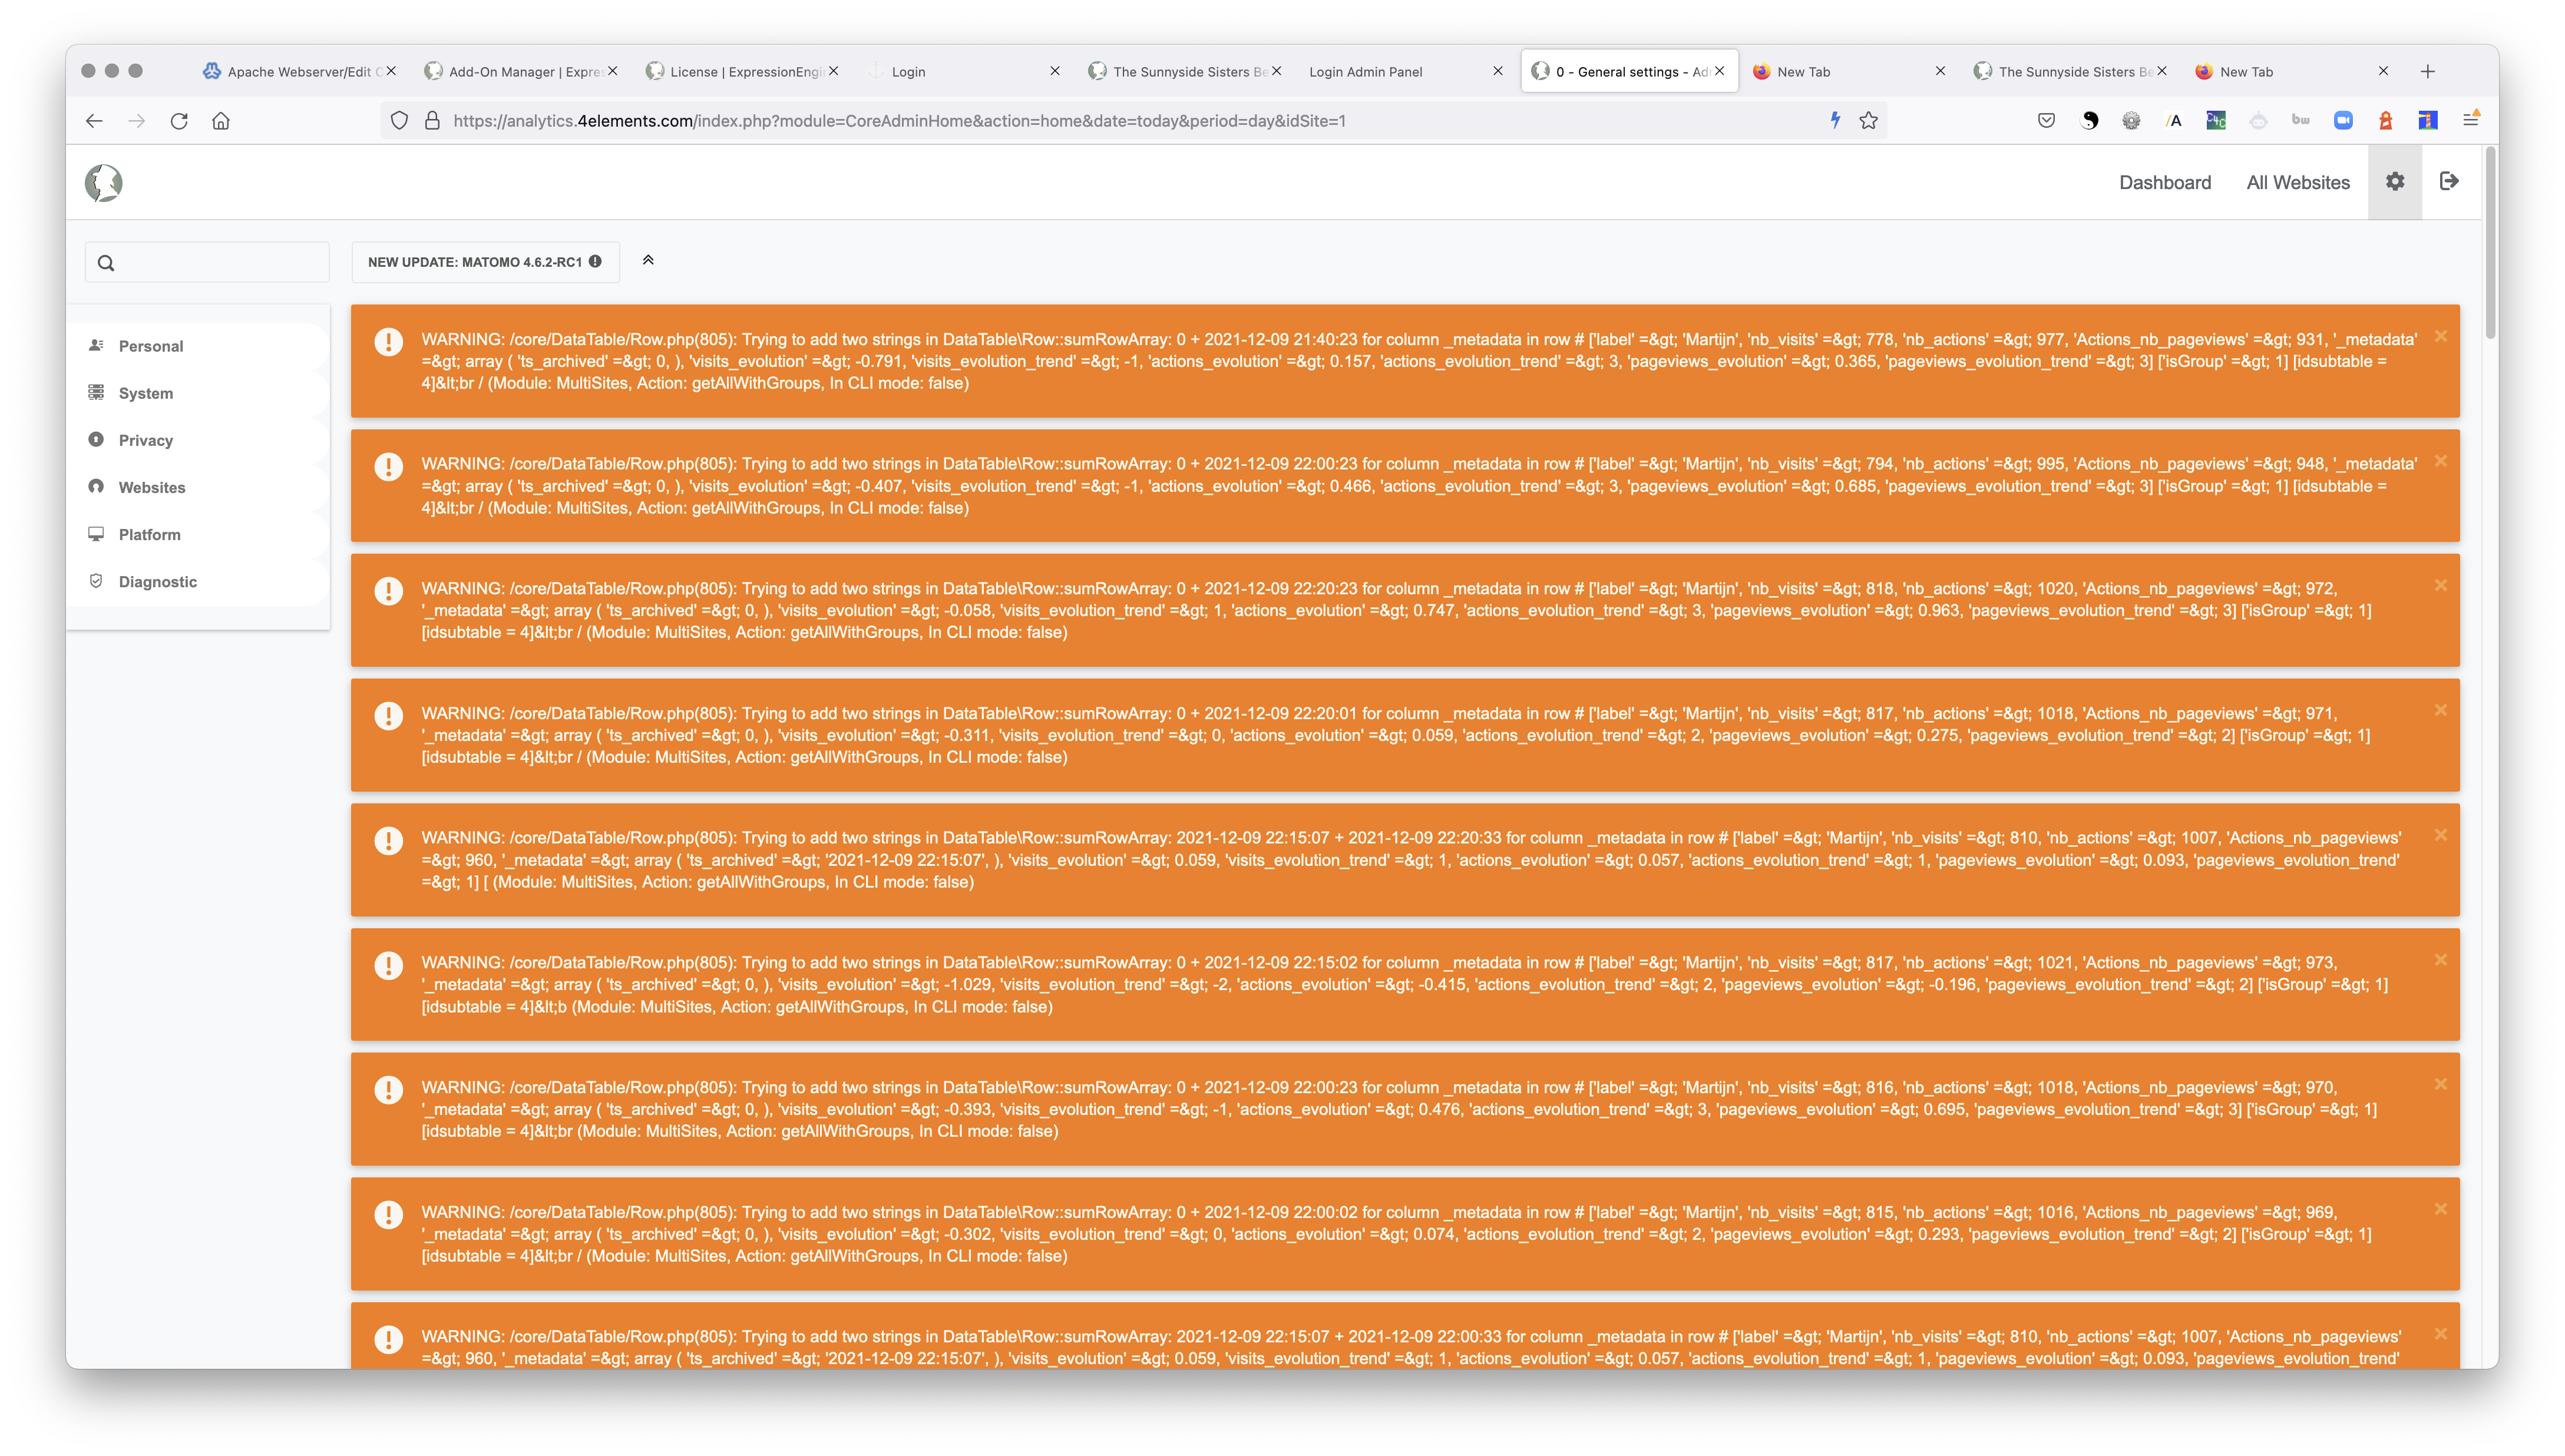
WARNING: /core/DataTable/Row.php(805): Trying to add two strings in DataTable\Row::sumRowArray: 2021-12-07 01:50:26 + 2021-12-07 02:05:12 for column _metadata in row # [‘label’ => ‘Martijn’, ‘nb_visits’ => 73, ‘nb_actions’ => 82, ‘Actions_nb_pageviews’ => 79, ‘Goal_revenue’ => 0, ‘Goal_nb_conversions’ => 0, ‘_metadata’ => array ( ‘ts_archived’ => ‘2021-12-07 01:50:26’, ), ‘visits_evolution’ => 2.076, ‘visits_evolution_trend’ => 1, ‘actions_evolution’ => 1.504, ‘actions_evolution_trend’ => 1, ‘pageviews_evolution’ (Module: MultiSites, Action: getAllWithGroups, In CLI mode: false)
WARNING: /core/DataTable/Row.php(805): Trying to add two strings in DataTable\Row::sumRowArray: 2021-12-08 13:40:22 + 2021-12-08 13:25:01 for column _metadata in row # [‘label’ => ‘Martijn’, ‘nb_visits’ => 462, ‘nb_actions’ => 556, ‘Actions_nb_pageviews’ => 529, ‘_metadata’ => array ( ‘ts_archived’ => ‘2021-12-08 13:40:22’, ), ‘visits_evolution’ => -0.107, ‘visits_evolution_trend’ => -1, ‘actions_evolution’ => -0.019, ‘actions_evolution_trend’ => -1, ‘pageviews_evolution’ => -0.048, ‘pageviews_evolution_trend’ => (Module: MultiSites, Action: getAllWithGroups, In CLI mode: false)
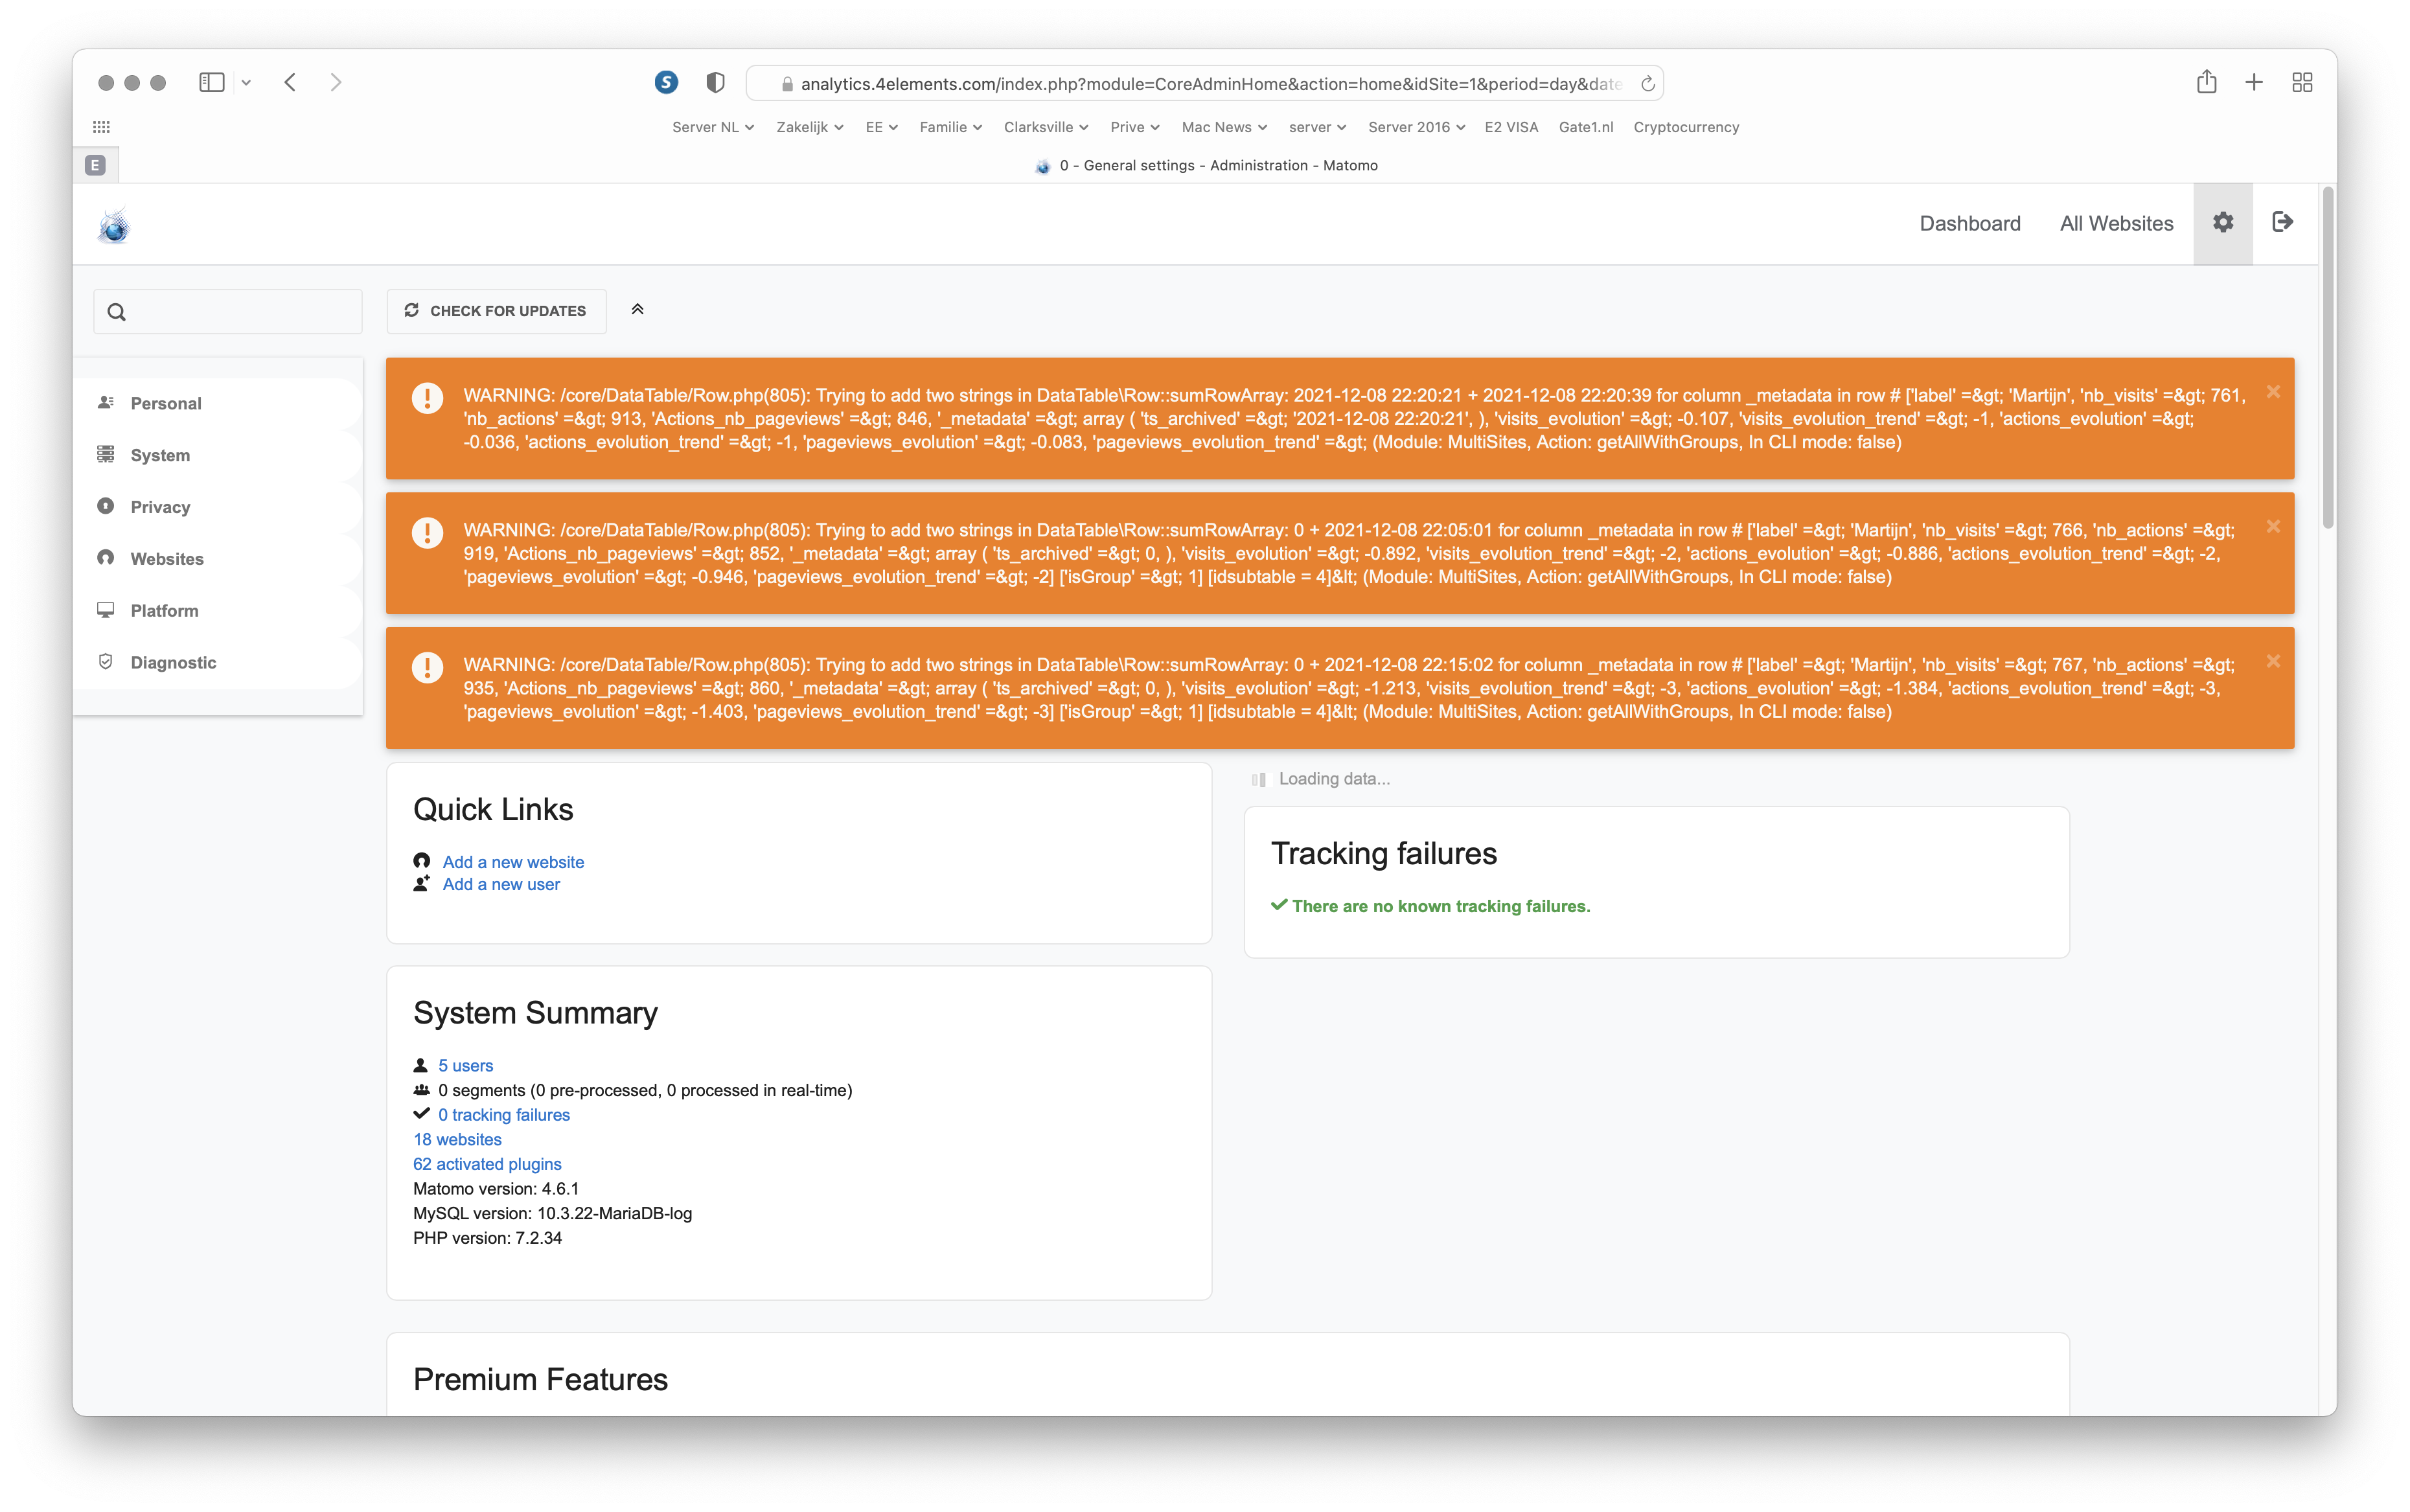
WARNING: /core/DataTable/Row.php(805): Trying to add two strings in DataTable\Row::sumRowArray: 0 + 2021-12-08 13:40:39 for column _metadata in row # [‘label’ => ‘Martijn’, ‘nb_visits’ => 465, ‘nb_actions’ => 561, ‘Actions_nb_pageviews’ => 533, ‘_metadata’ => array ( ‘ts_archived’ => 0, ), ‘visits_evolution’ => -0.213, ‘visits_evolution_trend’ => -2, ‘actions_evolution’ => -0.469, ‘actions_evolution_trend’ => -2, ‘pageviews_evolution’ => -0.452, ‘pageviews_evolution_trend’ => -2] [‘isGroup’ => 1] [idsubtable = 4]< (Module: MultiSites, Action: getAllWithGroups, In CLI mode: false)
So why all the warnings!! Before 4.6 I never got these? What to do?
Where these warnings appears?
When do they appear? (when tracking, when archiving, etc.
What is the previous version of Matomo?
It appears on every window I load. (Every page of analytics)
Previous version was 4.5.0 → 4.6.1
Do you have screen print?
I created a bug in the GitHub repo:
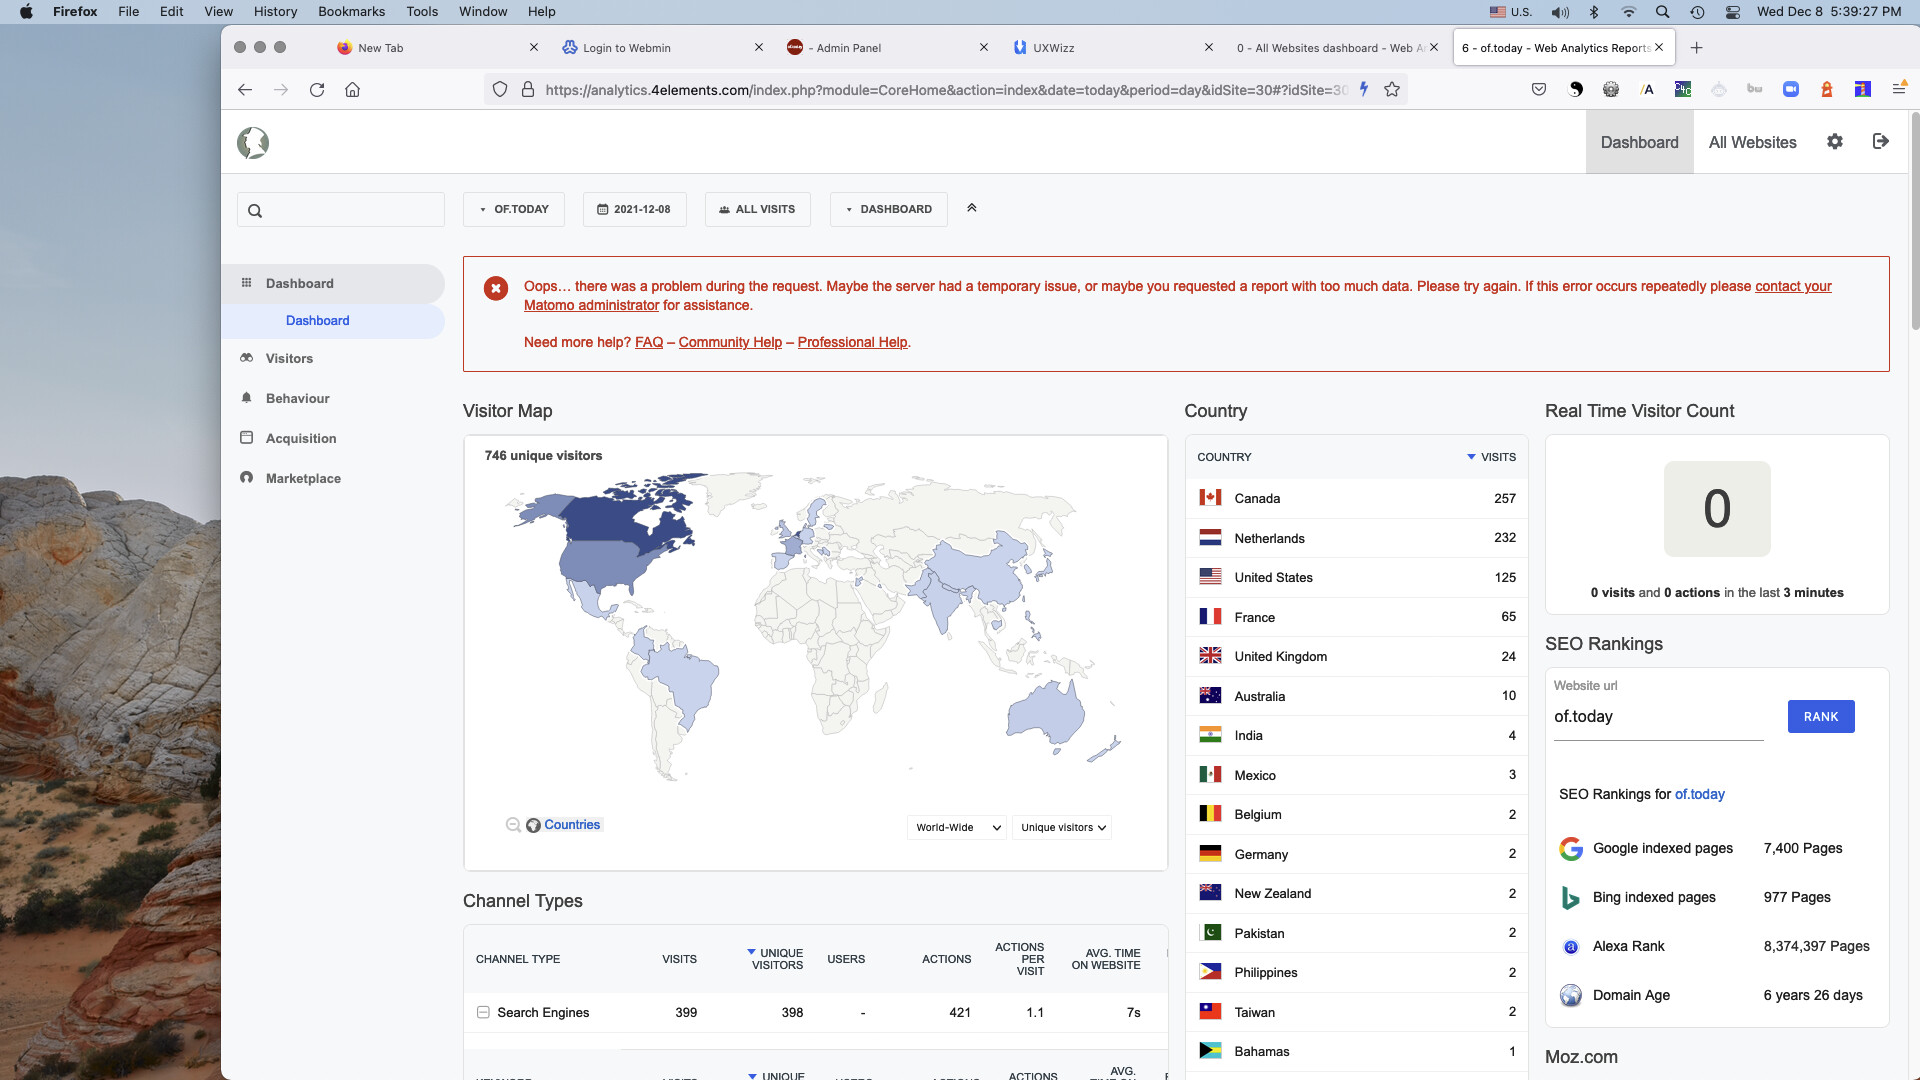
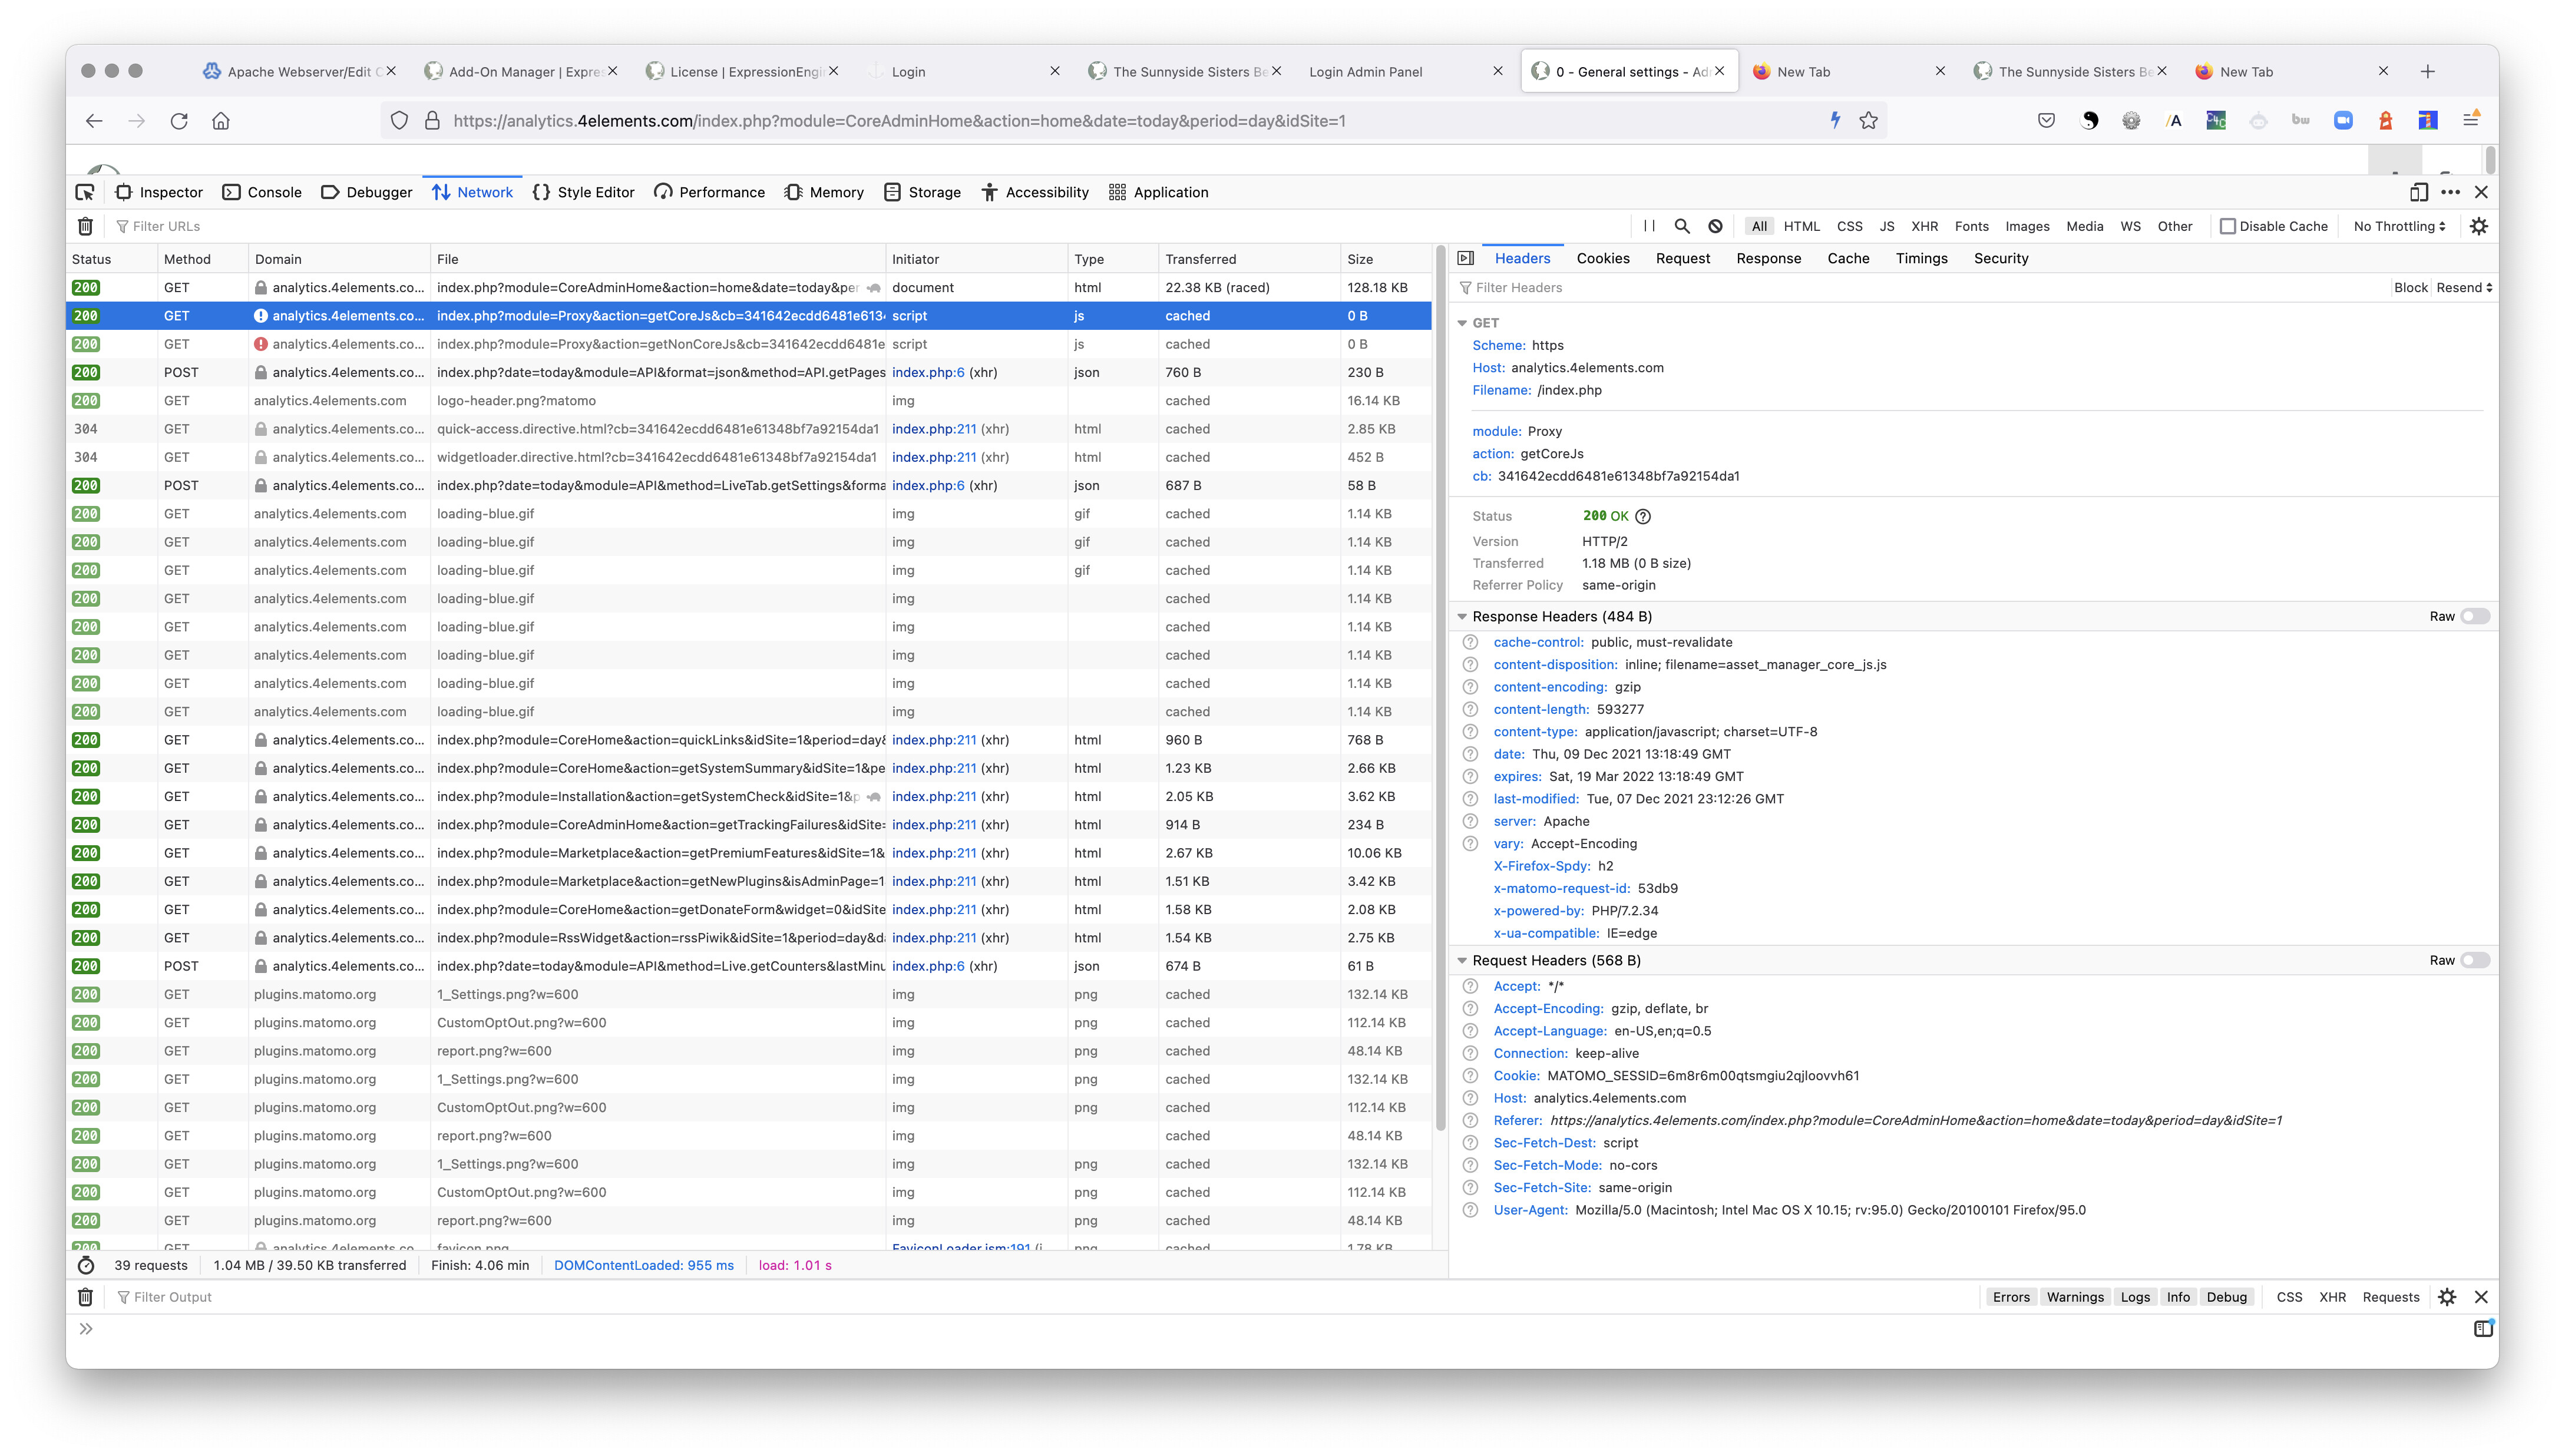
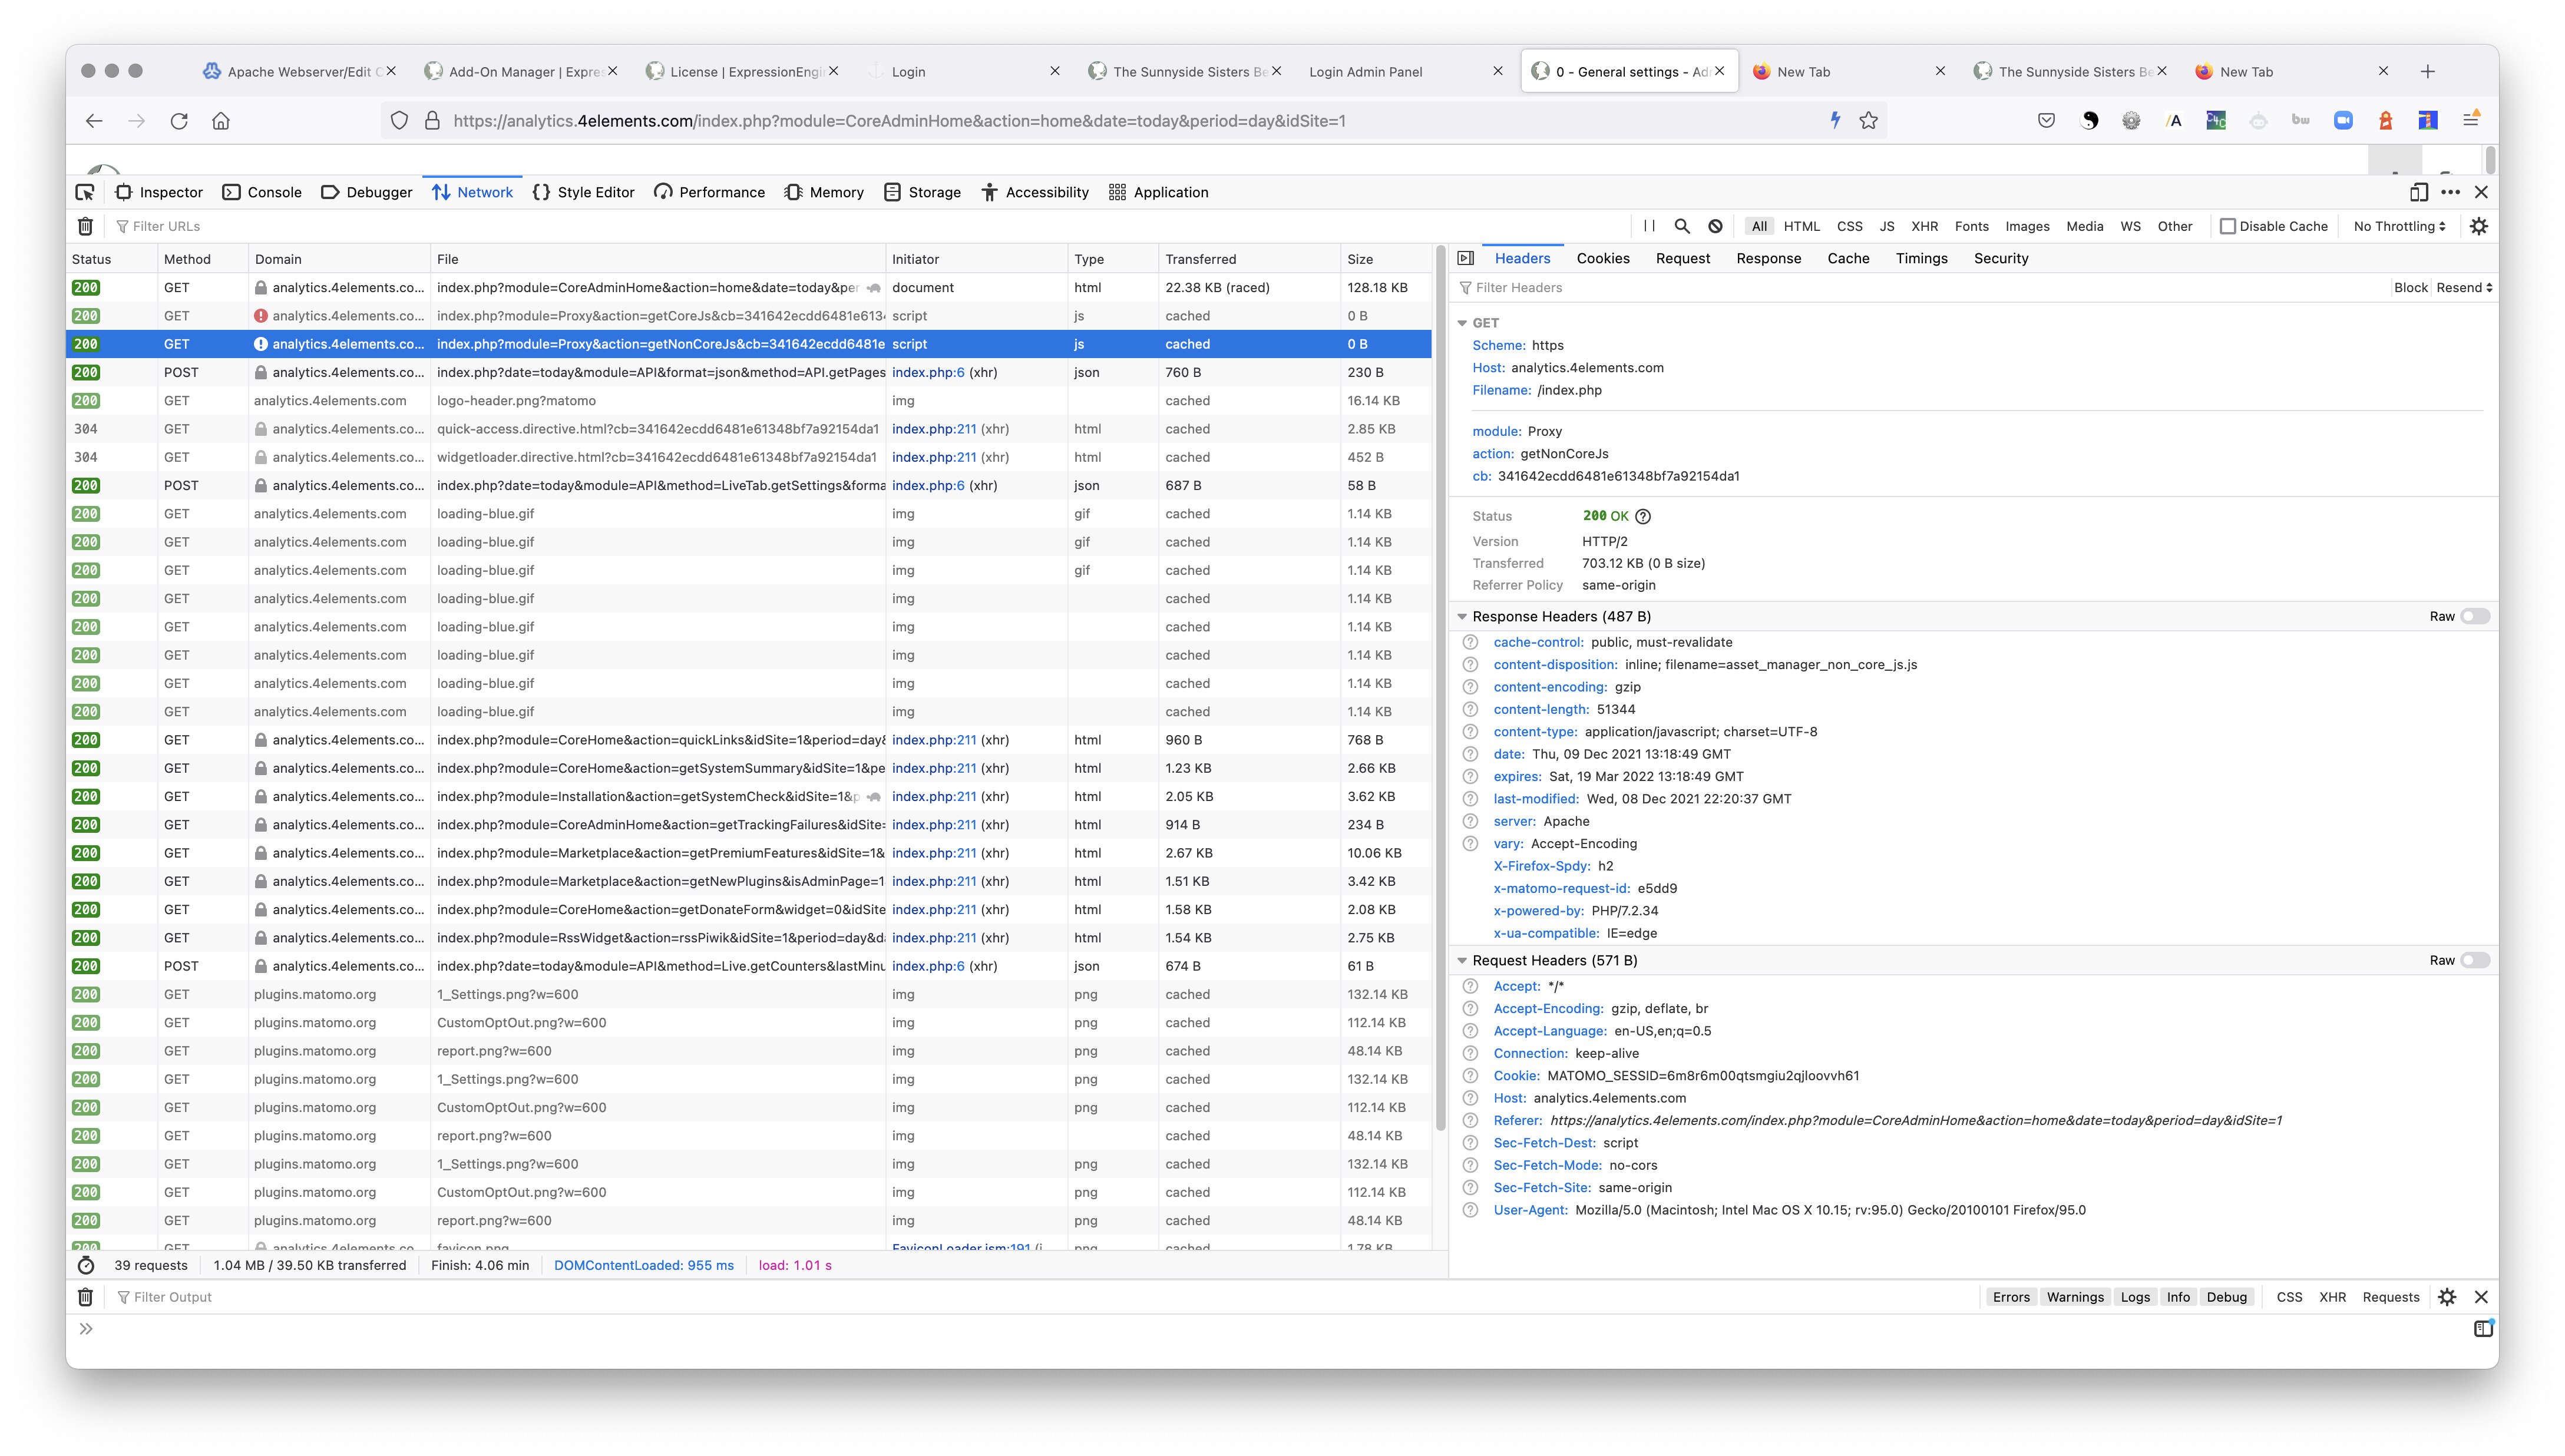
Are you able to say which request fails on the dashboard? Should be visible in the browser console (F12, then Network tab).
Please also add the response body of the HTTP request error
Will do that next time, just loaded main administration and got
If I press reload browser the messages will be gone!, so next time I will copy the HTTP request error

This should be fixed with the next release (4.7).
Let us know it this works or not…
Ok, I will let you know…