Hi there,
of course I know the report PDF function and we already use it.
Unfortunately, the evaluations with the important key figures are 40-60 pages long - but nobody reads them!
My question is:
Can you also customize the PDFs yourself (actually just like with the dashboards)? We would like to send a short and meaningful report monthly, which is not 45 pages long, but summarized with the most important statistics on 1-2 pages.
Example see here:
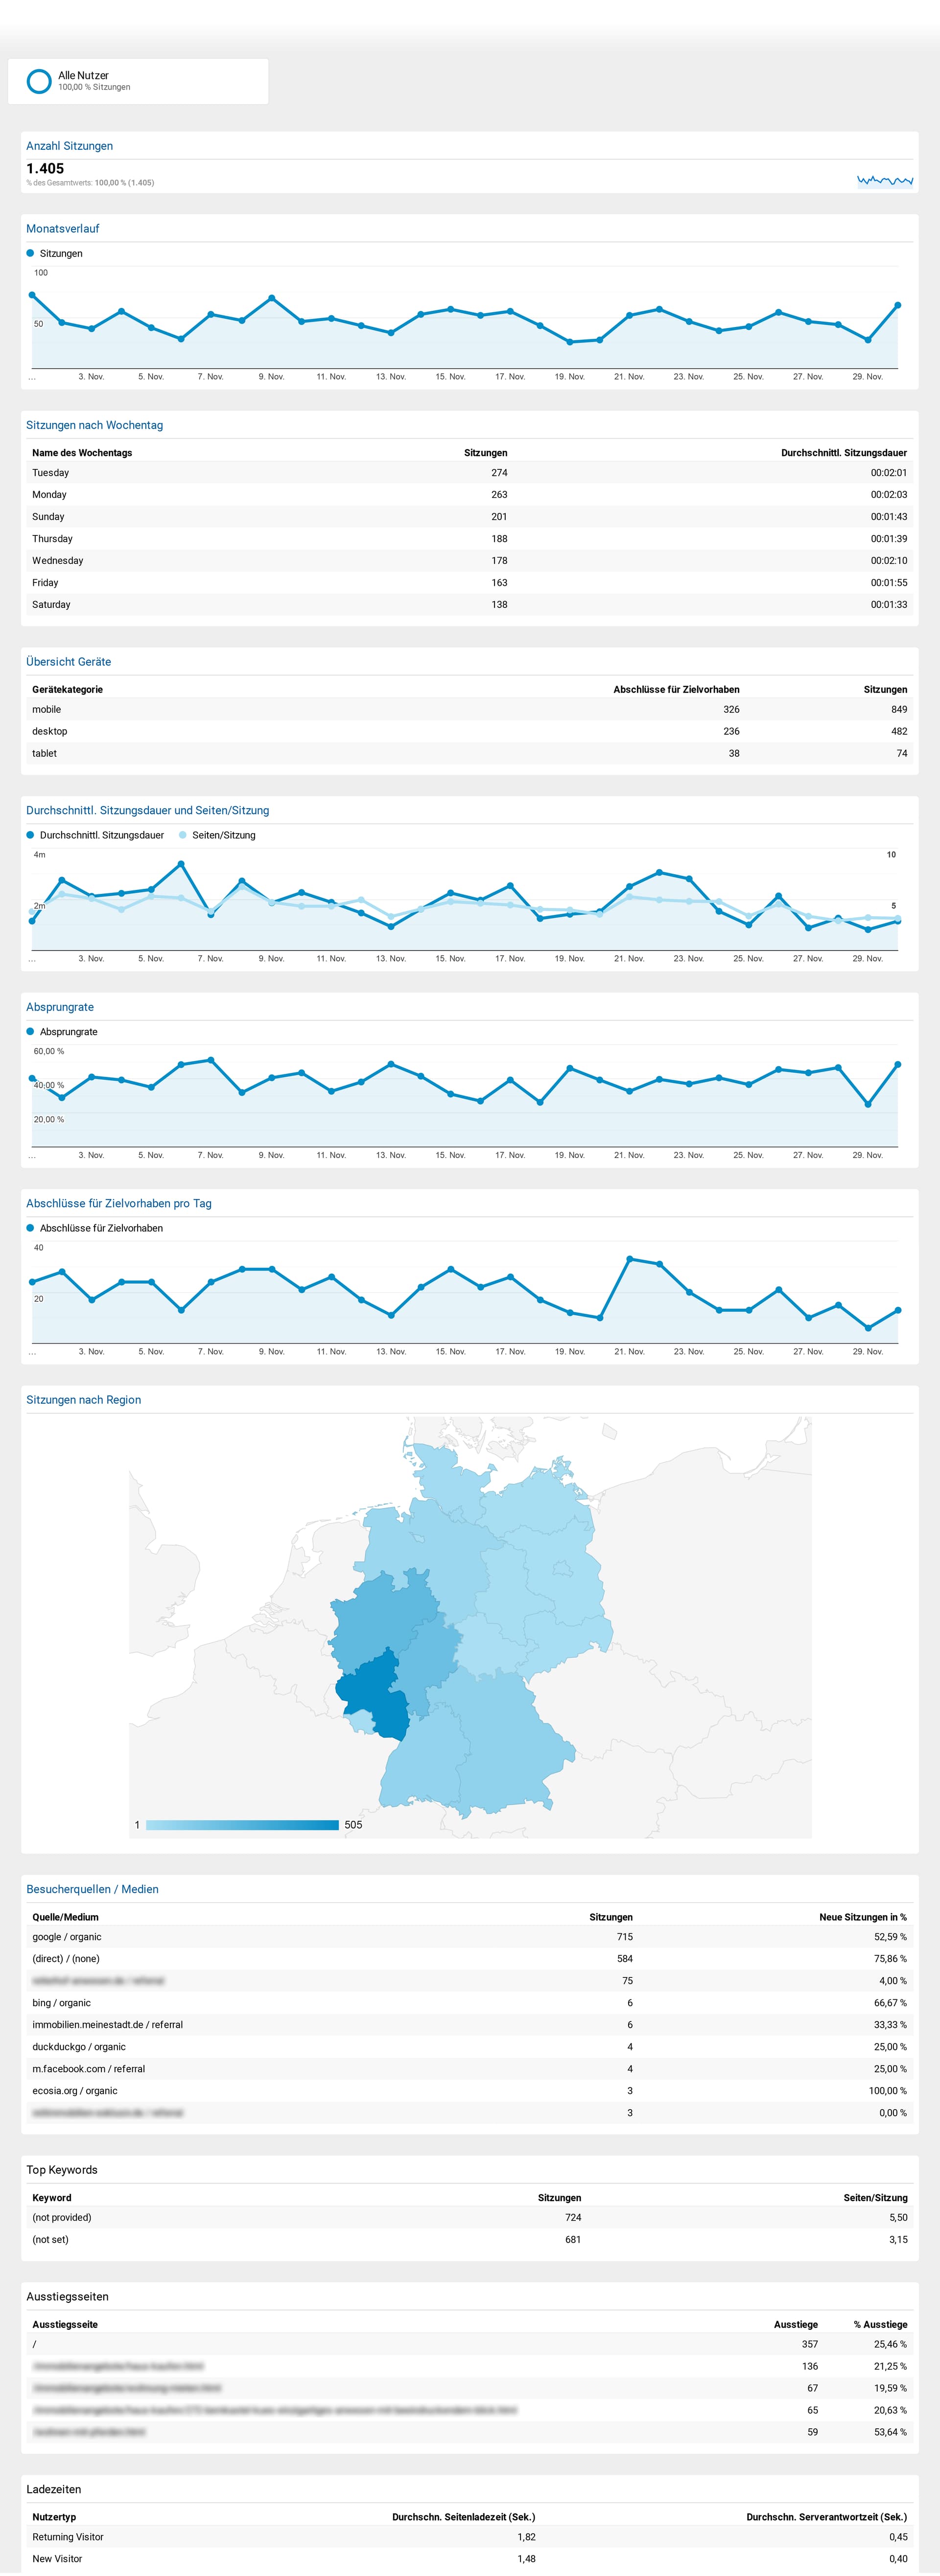
It would be great if the reports could be customized like the dashboards. So that you can display the most important statistics (also in graphs) on 1-2 PDF pages and send them monthly by email. We had used this function with Google Analytics (created our own dashboard & sent it monthly by mail) and we really miss this function with Matomo!
But otherwise we are really happy with Matomo ![]()