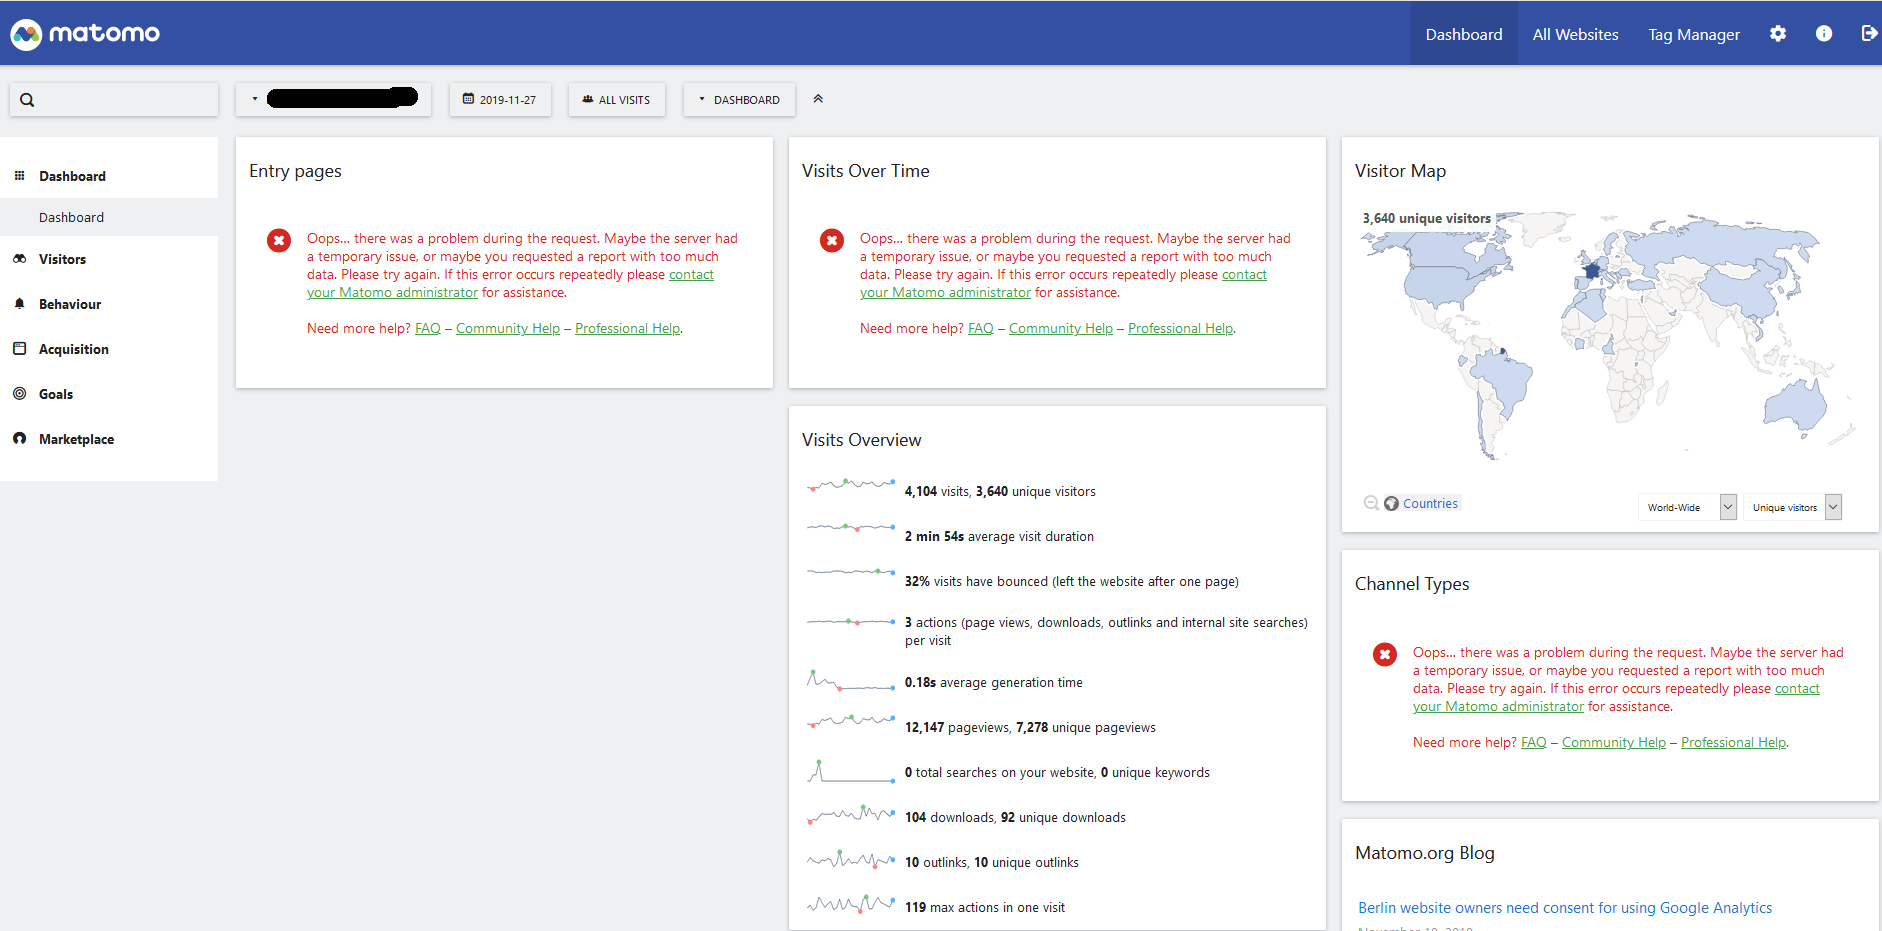
I’ve a big bug with all graphs on the admin interface just after the last update. I’ve chosen the automatic update as I always done, and now all graphs don’t show anything more:
I can’t know what error is occuring on your server, so the only way to find out is by looking at the PHP error log. There schould be more information on why these requests are failing.
The error occurs in PHP so you can see the logs wherever PHP is configured on your system to store log files.
For example, I am using Debian, Nginx and PHP fpm and store my error logs to /var/log/nginx/matomo.error.log. If you don’t maintain your PHP server setup yourself then the person that does might be able to help you further.
And there is absolutely nothing in this log file, and nothing in others log files.
I use the last version updated op PHP 7.3.11-1
nothing wrong in Admin > system check (in matomo admin interface)
BUT I think it is the last matomo update that is buggy, I explain:
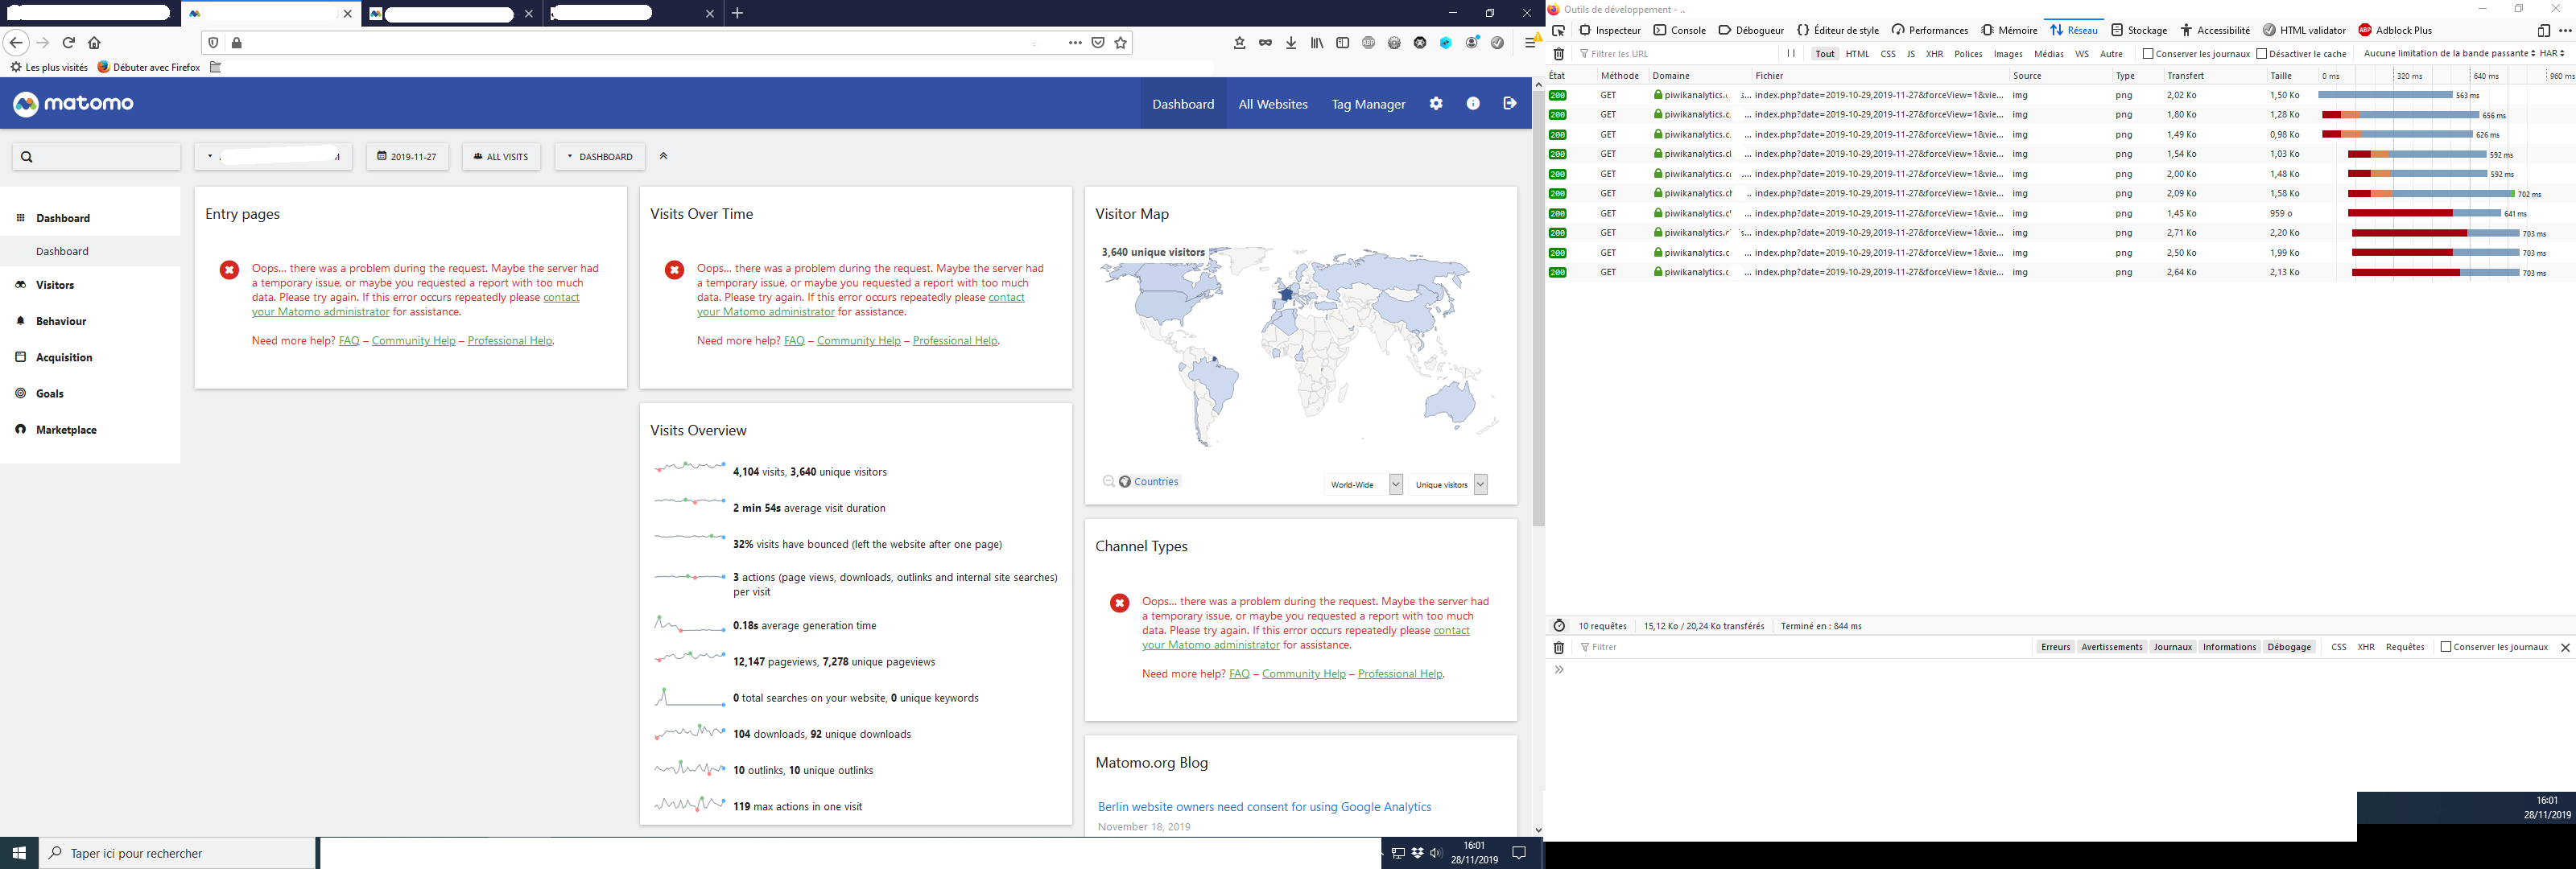
with firefox, when you open the window dashboard of matomo, and open the develloper console, you can see that the graphs images files are ok, but don’t appears in the admin interface:
here we go, look at the right screen, images files are ok, look at the left screen, all is wrong…
thanks for your reply, it help me to solve the problem, juste after the matomo update, the tmp cache folder was unwrittable, d’ont know why…
A fatal error occurred
The following error just broke Matomo (v3.13.0):
An exception has been thrown during the rendering of a template ("Unable to write in the cache directory
Why the update process can’t do itself some checks before copying files, and gently inform you on what is wrong? It happened before and still happening.