"Average Time on Page" is different to the actual time spent on page

Hi there,

the “average time on page” is different to the actual time on page.

When I click on “Behaviour” and then on “Pages”, for a lot of pages I see “AVG. TIME ON PAGE” is 00:00:00. But when I click on “Open the segmented visits log” I see much different numbers.

A page that has 0 seconds “average time on page”, can show 2 or 3 minutes in the segmented visits log. So I wonder, how is the average calculated? Is it a bug? I have really hard times to understand since it should be like 2 minutes instead of 0 seconds. Can somebody explain me why this is shown as 00:00:00?

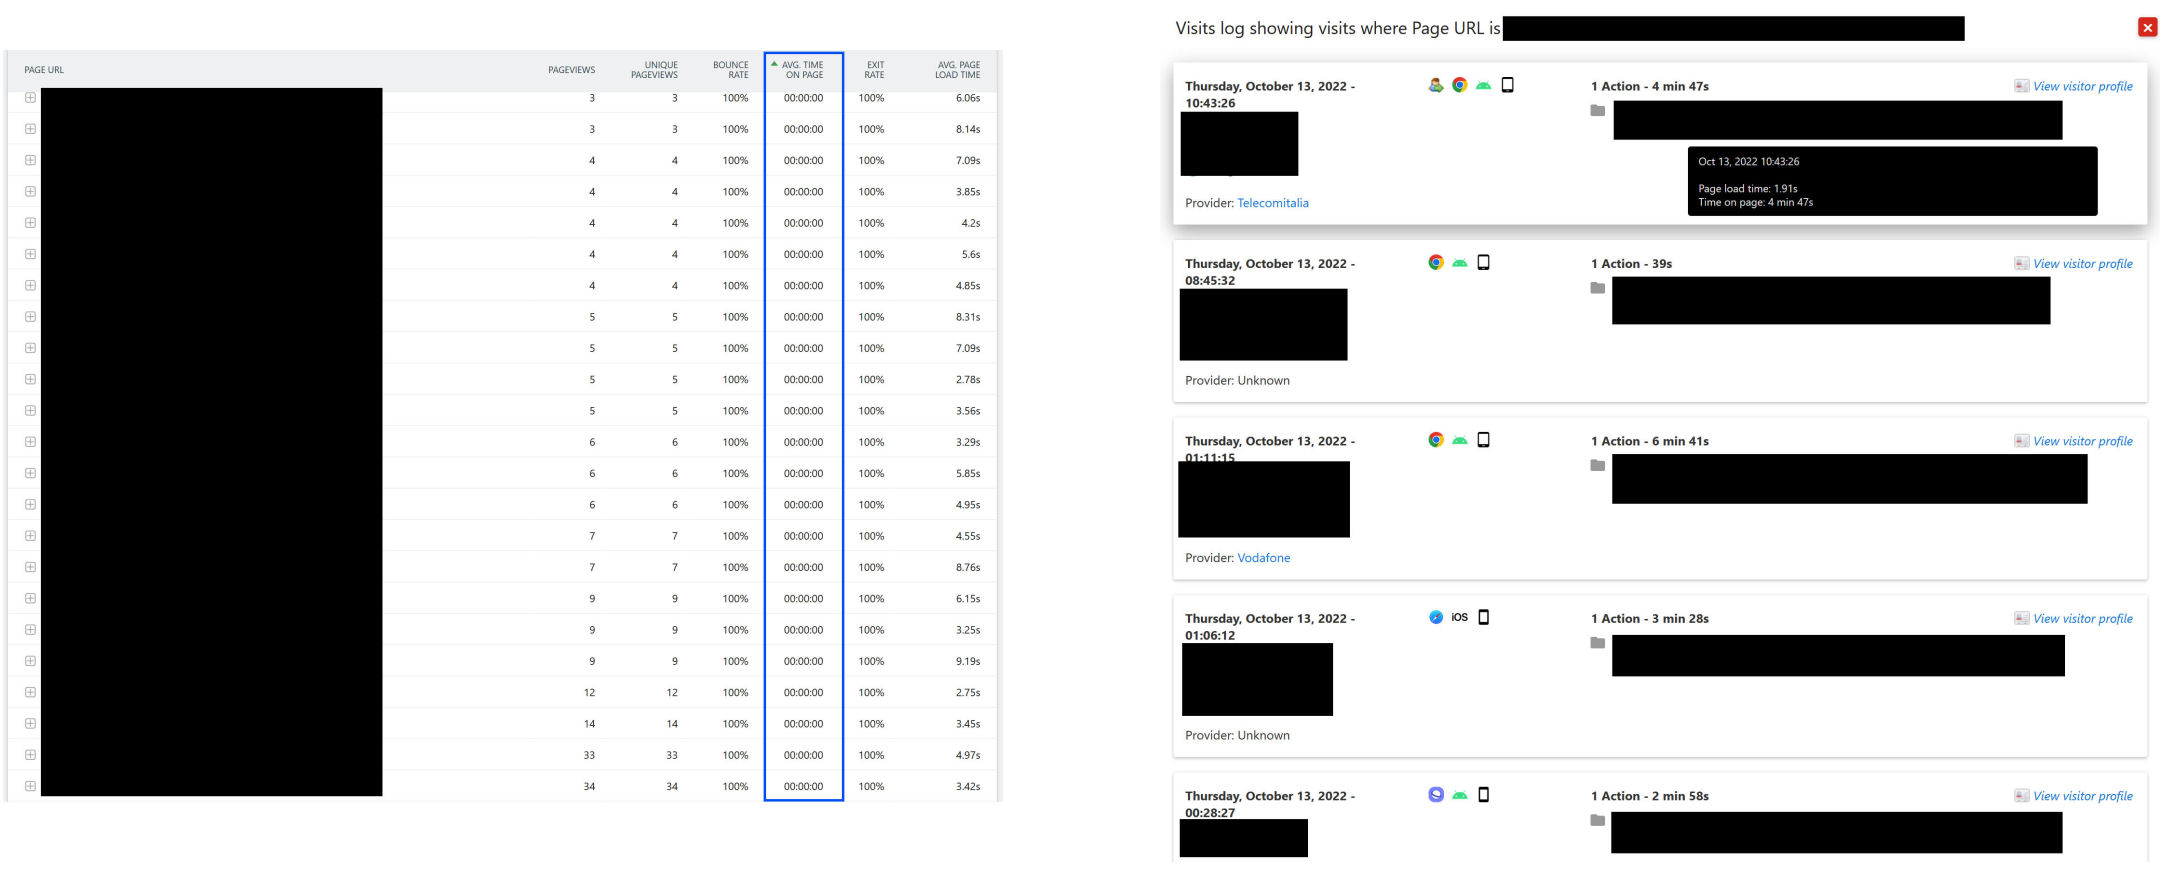
So in the following image we can see that the average time on page is 00:00:00.

However, when I open the segmented visits log its clear that the actual time spent on the page is much higher:

Does anybody know how to fix it? Or why this discrepancy exists? Is it actually correct and I just don’t understand how it is calculated?

Thanks a lot!
Andre

Which version of Matomo do you use?
Can you check on the error file (for data archiving) if there is some errors?

Hi,

this is the version:
Matomo version: 4.12.0

However, this discrepancy always occured, independentely from the Matomo version.

I don’t really know how to call the error file for data archiving.

Best,
Andre

Very strange, it works well on my side and also in the demo Matomo.

If you use the CRON for data archiving, the log file may be defined in the CRON command. If no CRON, it may be the same log file as Matomo log file.

Hi. I’m interested in knowing more about this topic. I have a similar problem. @talchamp did you find any resolution or answer to your problem?

HI.
Thank you for reporting this topic. I have the same problem with tagmanager too (Matomo 4.14.1). Is there any solution?