Hello all,
the average page load time is supposed to be the sum of all previous metrics listed, but it is always lower (we can see differences between the “total” displayed when we move the mouse on the graph and the value in the global performance table below). Can anybody explain it ?
I’m trying to get the correct value of average page load time for a whole site on a monthly basis.
Hi @Yomghi
This is probably due to some roundings…
See:
@heurteph-ei thank you for your answer, I tried to investigate what does “some roundings” mean and I couldn’t figure it out.
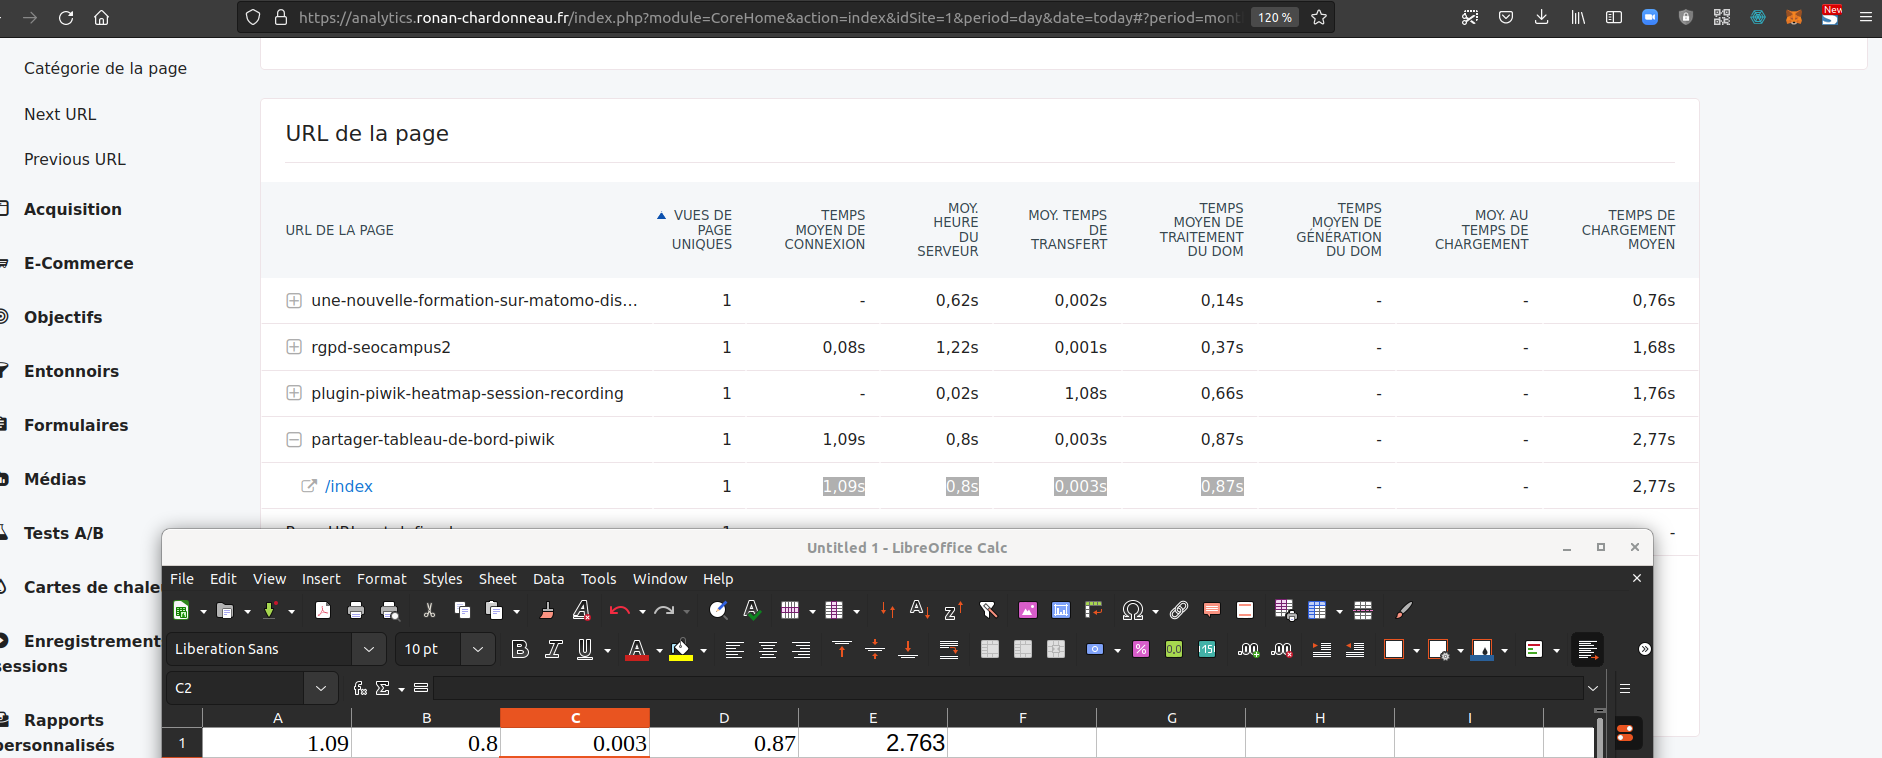
Here is what I performed, I exported the performances per day for a month basis and tried to make the mathematics and it didn’t work out.
To me there is clearly an issue.
Within the bar graph, the count is correct, and within the table below the graph, the mathematics are wrong. To me the difference is too high to be due to rounding.
Let’s say you round to the unit…
Then 0.4 would be rounded 0. And 2*0.4 would be 0.8, and rounded 1. In my case 0 + 0 = 1
The same with 0.6 (rounded 1). In this case 1 + 1 = 1
As the (average) load time is the sum of 6 other (average) values, then the rounding error can be increased…