Archiving causes high server load and crashes the MySQL database

Since last week, our self hosted Matomo creates a huge server load, up to crashing the database server.

Today we moved matoma and the (3,5 GB) database to another (better - 48 cores, 128GB RAM) webserver but the same issue here. The load avarage increases from 0.15 to 4.48 to 5.4.

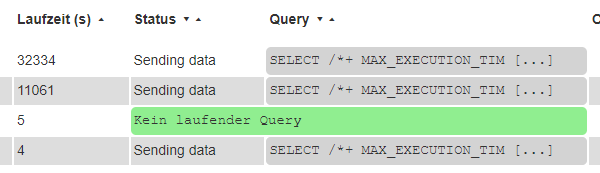
The support told us, it’s caused is the following MySQL process:

-------------------------------------------------------------------------------------------------------------
| Id    | User     | Host               | db                | Command | Time  | State        | Info
| 12953 | ABC  | MyHost.com:39350 | database | Execute | 48818 | Sending data |

 SELECT  /*+ MAX_EXECUTION_TIME(7200000) */
          yyy.idvisit AS idvisit,
          7 AS idgoal,
          4 AS `type`,
          yyy.idaction AS idaction,
          COUNT(*) AS `1`,
          ROUND(SUM(yyy.revenue_total),2) AS `2`,
          COUNT(yyy.idvisit) AS `3`,
          ROUND(SUM(yyy.revenue_subtotal),2) AS `4`,
          ROUND(SUM(yyy.revenue_tax),2) AS `5`,
          ROUND(SUM(yyy.revenue_shipping),2) AS `6`,
          ROUND(SUM(yyy.revenue_discount),2) AS `7`,
          SUM(yyy.items) AS `8`,
          yyy.pages_before AS `9`,
          SUM(yyy.attribution) AS `10`,
          COUNT(*) AS `12`,
          ROUND(SUM(yyy.revenue),2) AS `15`
        FROM (
          SELECT
            num_total AS pages_before,
            1 / num_total AS attribution,
            r.idvisit AS idvisit,
            lac.idaction AS idaction,
            lvcon.revenue AS revenue_total,
            1 / num_total * lvcon.revenue AS revenue,
            1 / num_total * lvcon.revenue_subtotal AS revenue_subtotal,
            1 / num_total * lvcon.revenue_tax AS revenue_tax,
            1 / num_total * lvcon.revenue_shipping AS revenue_shipping,
            1 / num_total * lvcon.revenue_discount AS revenue_discount,
            1 / num_total * lvcon.items AS items
          FROM (
            SELECT /* sites 1 */ /* 2023-08-03,2023-08-04 */ /* Actions */ /* trigger = CronArchive */
                                log_conversion.idvisit, COUNT(*) AS num_total
                        FROM
                                piwik_log_conversion AS log_conversion RIGHT JOIN piwik_log_link_visit_action AS log_vpast ON log_conversion.idvisit = log_vpast.idvisit LEFT JOIN piwik_log_action AS lac_past ON log_vpast.idaction_name = lac_past.idaction
                        WHERE
                                log_conversion.server_time >= '2023-08-03 22:00:00'
                                AND log_conversion.server_time <= '2023-08-04 21:59:59'
                                AND log_conversion.idsite IN ('1')AND log_conversion.idgoal = 7
                          AND log_vpast.server_time <= log_conversion.server_time
                          AND lac_past.type = 4
                        GROUP BY
                                log_conversion.idvisit
          ) AS r
          LEFT JOIN piwik_log_conversion lvcon ON lvcon.idgoal = 7 AND lvcon.idvisit = r.idvisit
          RIGHT JOIN piwik_log_link_visit_action logv ON logv.idvisit = r.idvisit
          LEFT JOIN piwik_log_action lac ON logv.idaction_name = lac.idaction
          WHERE logv.server_time >= '2023-08-03 22:00:00'
            AND logv.server_time <= '2023-08-04 21:59:59'
            AND logv.idsite IN (1)
            AND lac.type = 4
            AND logv.server_time <= lvcon.server_time
          ) AS yyy
        GROUP BY yyy.idaction
        ORDER BY `9` DESC                                      

which is running 5 times at the moment.

Are there any known issues or topics?

Thanks and best regards

We have found that one complete kernel is blocked per day by a MySQL process and the server thus has an increasingly high load. Today 10 open MySQL processes running simultaneously and we had to kill seven to get the server running properly again.

We are using the latest Matomo version and so far it has been running very stable as usual for years.
The issue is cause by:

SELECT  /*+ MAX_EXECUTION_TIME(7200000) */ 
          yyy.idvisit AS idvisit,
          7 AS idgoal,
          4 AS `type`,
          yyy.idaction AS idaction,
          COUNT(*) AS `1`,     
          ROUND(SUM(yyy.revenue_total),2) AS `2`,          
          COUNT(yyy.idvisit) AS `3`,                   
          ROUND(SUM(yyy.revenue_subtotal),2) AS `4`,                 
          ROUND(SUM(yyy.revenue_tax),2) AS `5`,
          ROUND(SUM(yyy.revenue_shipping),2) AS `6`,
          ROUND(SUM(yyy.revenue_discount),2) AS `7`,
          SUM(yyy.items) AS `8`,
          yyy.pages_before AS `9`,                    
          SUM(yyy.attribution) AS `10`,                    
          COUNT(*) AS `12`,              
          ROUND(SUM(yyy.revenue),2) AS `15`         
        FROM (
          SELECT
            num_total AS pages_before,
            1 / num_total AS attribution,
            r.idvisit AS idvisit,
            lac.idaction AS idaction,
            lvcon.revenue AS revenue_total,
            1 / num_total * lvcon.revenue AS revenue,
            1 / num_total * lvcon.revenue_subtotal AS revenue_subtotal,
            1 / num_total * lvcon.revenue_tax AS revenue_tax,
            1 / num_total * lvcon.revenue_shipping AS revenue_shipping,
            1 / num_total * lvcon.revenue_discount AS revenue_discount,
            1 / num_total * lvcon.items AS items
          FROM (
            SELECT /* sites 1 */ /* 2023-08-03,2023-08-04 */ /* Actions */ /* trigger = CronArchive */
				log_conversion.idvisit, COUNT(*) AS num_total
			FROM
				piwik_log_conversion AS log_conversion RIGHT JOIN piwik_log_link_visit_action AS log_vpast ON log_conversion.idvisit = log_vpast.idvisit LEFT JOIN piwik_log_action AS lac_past ON log_vpast.idaction_name = lac_past.idaction
			WHERE
				log_conversion.server_time >= '2023-08-03 22:00:00'
				AND log_conversion.server_time <= '2023-08-04 21:59:59'
				AND log_conversion.idsite IN ('1')AND log_conversion.idgoal = 7 
                          AND log_vpast.server_time <= log_conversion.server_time
                          AND lac_past.type = 4
			GROUP BY
				log_conversion.idvisit
          ) AS r
          LEFT JOIN piwik_log_conversion lvcon ON lvcon.idgoal = 7 AND lvcon.idvisit = r.idvisit
          RIGHT JOIN piwik_log_link_visit_action logv ON logv.idvisit = r.idvisit
          LEFT JOIN piwik_log_action lac ON logv.idaction_name = lac.idaction
          WHERE logv.server_time >= '2023-08-03 22:00:00'
            AND logv.server_time <= '2023-08-04 21:59:59'
            AND logv.idsite IN (1) 
            AND lac.type = 4
            AND logv.server_time <= lvcon.server_time
          ) AS yyy
        GROUP BY yyy.idaction
        ORDER BY `9` DESC

Any idea regarding the problem or how we can solve it?

Thanks and best regards

Hello,

does anyone have any ideas?
We have to check the server every day and kill the database process manually, because it never ends and new processes will be created. Up to 20 porcesses overloads/kills our web server and trackings are no longer recorded.

We already started a new installation of Matomo 4.15.1, increased Memory and starting the archive cron every 15 minutes. Only this grants the creation of reports but sometimes left never ending database processes.

The screenshot shows some processes, our maximum was 30 running processes after 10 days without killing processes the server crashed.
image

I think it’s the archive script that causes this issue.

Thanks and best regards

Hi @AR-HO
Did you have a look at:

I’ve implemented personally on different Matomo domains this :

It’s a bit of tweaking around but the cron jobs work fine.
Just make sure to test the archiving to see it works fine, there’s commands to test the crons ar per documentation.

I am running multiple Matomo domains on separate servers and have 6% usage of memory at any given time.
No spikes, never had issues.
The Matomo domains track multiple other sites per each of them.

2 Likes

Hi Easton,

We are running into Archiving process issues.
The Matomo article you mentioned said that “If you run archiving several times per day, it will re-archive today’s reports, as well as any reports for a date range which includes today: current week, current month, etc.” Does it make sense to you?
So, it means that it doesn’t just re-archive today’s data, but it goes back to the current week and current month. So it runs week, month, year on every run.
Our archiving process still processing 10/22’s data with period = day even if it said it was complete (see below):
Here is the log from the last job that was ran successfully:
INFO [2023-10-31 16:15:32] 14392 SUMMARY
INFO [2023-10-31 16:15:32] 14392 Processed 184 archives.
INFO [2023-10-31 16:15:32] 14392 Total API requests: 184
INFO [2023-10-31 16:15:32] 14392 done: 184 req, 630195 ms, no error
INFO [2023-10-31 16:15:32] 14392 Time elapsed: 630.195s

Does it make sense to you?
Our last job that started was set to go up to 6GB of memory has been running for over an hour now and it is consuming about 4.5GB (and climbing).

Any support is welcome :blush:

Hi @Chiara_G
What is your version of Matomo?
How many trackings do you have per day?
How many segments, custom reports, additional plugins?
How are configured enable_processing_unique_visitors_* settings?

Yes, it reprocesses current week… But for most metrics, they are just the sum of daily metrics (except for unique metrics)

Hi ,

We are on Matomo Version: 4.15.1
We are roughly between 1 and 10 million page views per month or less.
We have 1 custom reports (we delete everything since we have this issue), 2 plugins (Heatmap & Session Recording and Customs Reports) and these are default settings since we have not modified them.

Yes my experience is that it reprocesses current week as @heurteph-ei mentioned. Did not see it reprocessing the current month or year.

As you got 1-10 mil views, I also had a look at this: https://matomo.org/faq/on-premise/matomo-requirements/

As a general rule, when tracking more than 1 million user actions/pageviews/events per month, we recommend to have at least two servers, one for the database and one for handling all the HTTPS requests (Tracking, API, UI) and the Report processing.

1 Like

You track indeed a lot of data, then I suggest you follow @metrprime advises and also what described in Recommended settings for Matomo on high traffic websites with millions of page views previously mentioned FAQ.
Monthly unique visitors processing can also be huge consuming SQL resources…
I forgot to mention another source of resource consumption: The number of segments you created…

Can you confirm if segments are retroactive? A user from a year ago posted in the forum about segments being retroactive, meaning data for the segment started populating from the day/time the segment was created). We noticed the same thing on our end a few months ago. We just created new segments and noticed they are now retractive. Did something change with the last Matomo version update? We are currently using version 4.15.1

Hi @ahartsfield
Segments are “interactive” if you config process_new_segments_from value so…

When archiving segments for the first time, this determines the oldest date that will be archived. This option can be used to avoid archiving (for instance) the lastN years for every new segment. Valid option values include: “beginning_of_time” (start date of archiving will not be changed) “segment_last_edit_time” (start date of archiving will be the earliest last edit date found, if none is found, the created date is used) “segment_creation_time” (start date of archiving will be the creation date of the segment) editLastN where N is an integer (eg “editLast10” to archive for 10 days before the segment last edit date) lastN where N is an integer (eg “last10” to archive for 10 days before the segment creation date)