I’ve been working around this bug for a while, hoping it was introduced in a recent minor version, but evidently it’s been around for a while.
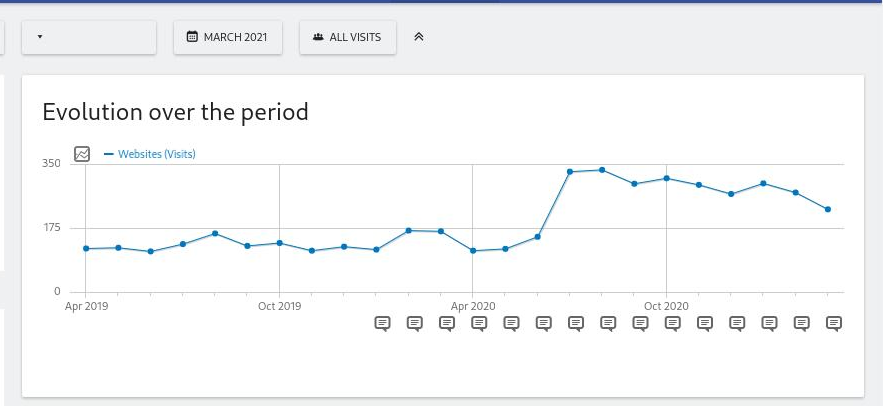
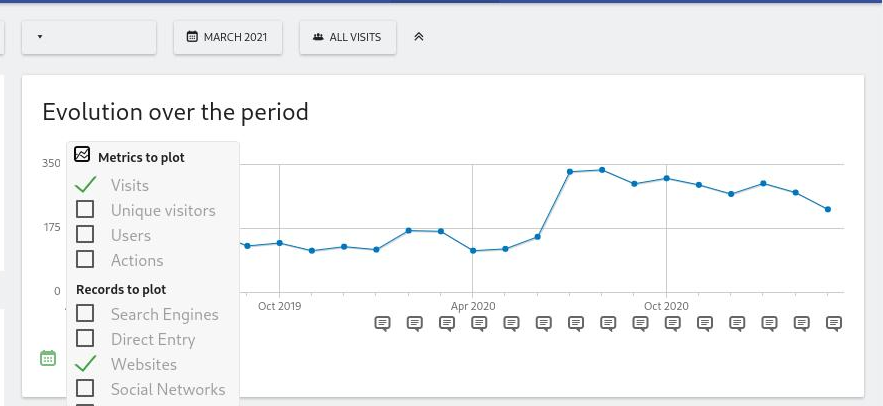
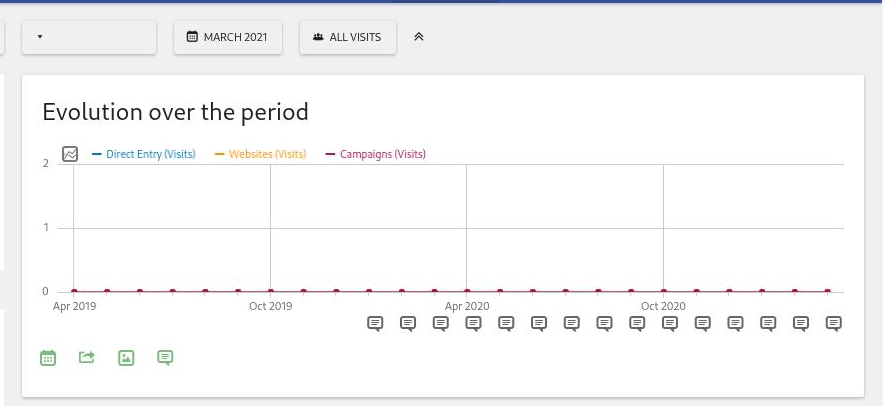
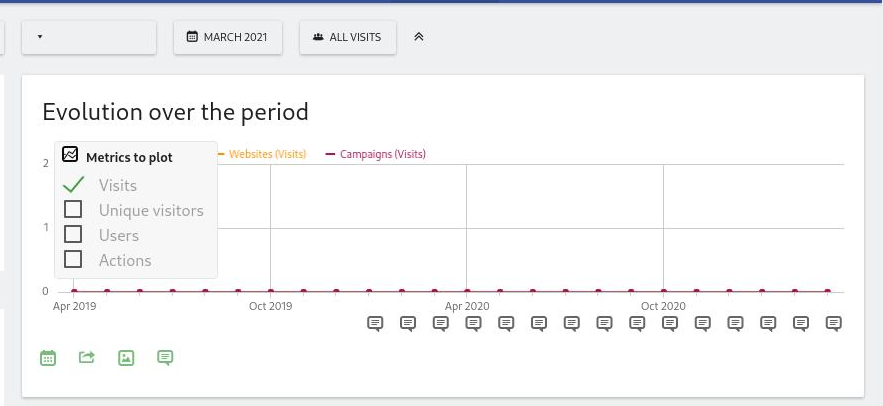
In the acquisition overview page, selecting various ‘records to plot’ almost invariably leads to funkiness:
- graph values flatline to zero
- it becomes difficult to select/deselect ‘records to plot’ items
- the ‘records to plot’ list disappears completely
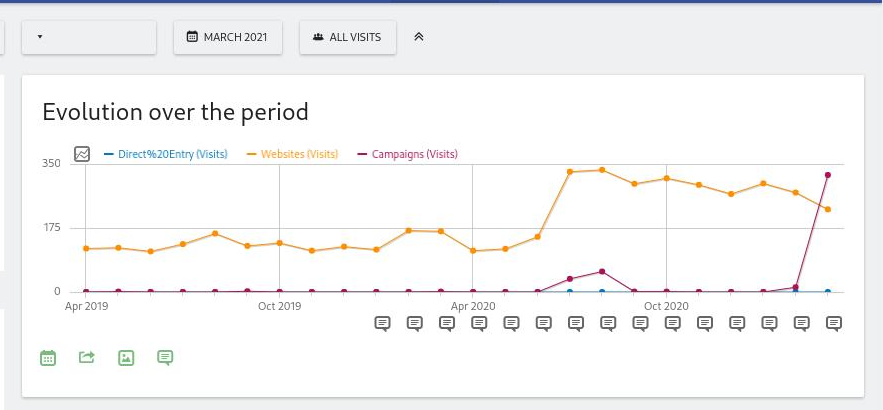
- sometimes the records labels above the graph have url-encoded spaces ('Direct%20Entry)
Based on the url encoding, my first thought was that it’s some sort of filtering/escaping bug. But I can’t seem to work out any patterns.
Sometimes a force-refresh fixes everything, but it’s extremely difficult to get the report I need without a lot of effort.