I came across a really strange bug on the queued tracking piece which has really got me confused about how this all works. Current documentation is seriously lacking so its hard to get the full picture.
I have set my queue to have 2 workers, one queue has cleared down very quickly, but the other hasn’t
it could be something to do with this when i try and execute;
./console queuedtracking:process --queue-id=X
When activating ./console queuedtracking:process --queue-id=0 specifically for queue-id=0, it doesn’t work, i get this error
ERROR [2020-07-06 09:10:58] 4700 Uncaught exception: C:\inetpub\wwwroot\vendor\symfony\console\Symfony\Component\Console\Input\ArgvInput.php(242): The “–queue-id” option requires a value.
It works for fine for “./console queuedtracking:process --queue-id=1”
the no queue specfic call seemed to work fine. Hmm, i just don’t know how it got this bad! any tips on how to clear down this excess data would be great and then i can track what on earth is going on
This might be a windows specific issue. I’m not extra familiar with windows CLI environments (if you’re using one), but can you try some way of quoting the 0 value? Something like ./console queuedtracking:process --queue-id="0"? Or maybe ./console queuedtracking:process --queue-id="00"? Something is keeping the value from being recognized correctly by symfony console (the composer package matomo uses to parse CLI arguments).
Thanks for the feedback diosmoiss - i tried all of those but = 00 seems to be accepted! Seriously, am delighted at that so many thanks!
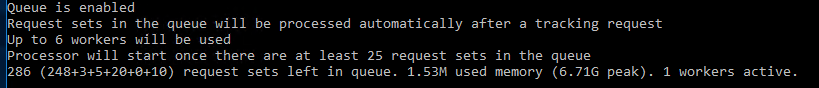
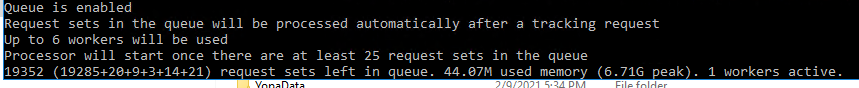
One last thing i’ve noticed - Matomoo is putting an extraordinary amount of requests into queue 0 in comparison with the other queues, why is that? I’ve got a feeling this is how my Redis got overloaded in the first place
OK i think i’ve bottomed out this root cause, or at least getting closer
Ok, I put a small sample of data into the redis db and executed all queues one by one, thanks to @diosmosis for the =00 trick. This is what i’ve found;
Forcing queue ID: 0 : This worker finished queue processing with 3.2req/s (150 requests in 46.91 seconds )
Forcing queue ID: 1 : This worker finished queue processing with 39.01req/s (125 requests in 3.20 seconds)
Forcing queue ID: 2 : This worker finished queue processing with 42.12req/s (150 requests in 3.56 seconds)
Forcing queue ID: 3 : This worker finished queue processing with 38.92req/s (125 requests in 3.21 seconds)
Forcing queue ID: 4 : This worker finished queue processing with 44.05req/s (100 requests in 2.27 seconds)
Forcing queue ID: 5 : This worker finished queue processing with 39.85req/s (125 requests in 3.14 seconds)
So its not that the there is more requests being routed to Queue ID 0 - its just the computing time of this specific queue is incredibly slow in comparison to the others!
The next question is… why on earth would that be happening ! Anything for me to look into here or advice would be great - feel like i’m getting closer