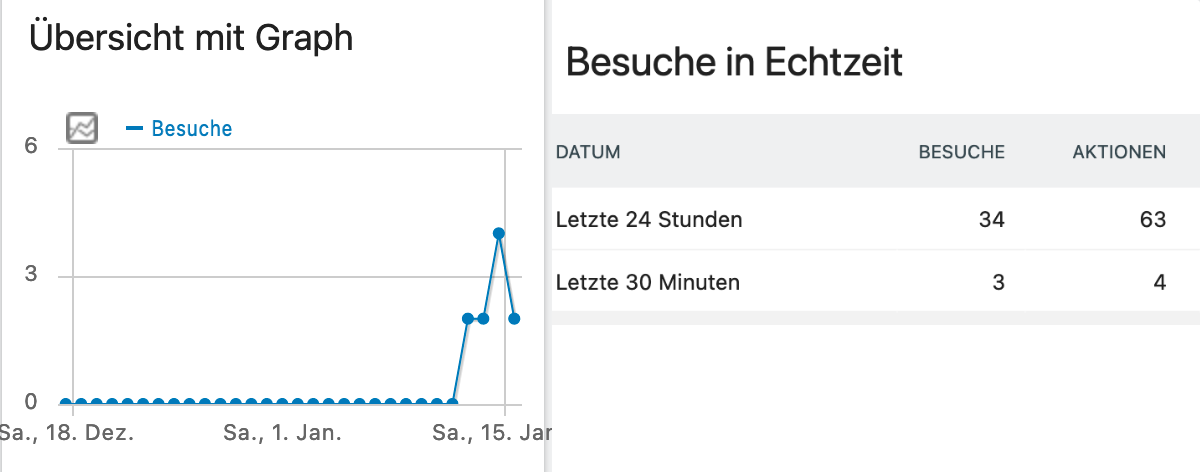
hi all, i just installed matomo for by brand new page, and i do not understand it. i get 34 visitors in the last 24h (or 3 in the last 30 minutes) according to “visitors in real time”, but when i look at the graph i get 10 IN TOTAL for the whole timeline (see screenshots). the realtime geographical view does also more ACTIVE visitors than the graph shows IN TOTAL.
i am very confused.
can somebody explain that to me?
Matomo-/PHP-Version: 4.6.2/8.0.14 (Docker image: “matomo”)
MySQL-Version: 10.6.2-MariaDB-1:10.6.2+maria~focal
Hin
Sorry, I don’t understand the values (64, 5, 10) you mentioned… I don’t see them in your graphs (2, 4, 2, 34, 3)…
@heurteph-ei it was meant like that:
24 hours: 34 visits (sorry, wrong column)
30 minutes: 3 visits (again wrong column, both fixed in original post)
but the graph shows IN TOTAL 10 visits (which is substantially less than 34)
When did you do the capture of “Letze 24 Stunden” (which date?) I suppose it was today January the 17th…
When you check the visits log (Besucher-Log), how many visits on Monday? How many on Sunday?
ah okay, it’s a time-delayed thing? i thought this was also a real time display. now i see more visits.
how can i “do the capture”?
Sorry, I don’t understand “do the capture”…