Under Behaviour › Performance, I can get some performance information on a site over various different periods of time (also via API, with period=…). But it appears that “day” is the shortest period we can query?
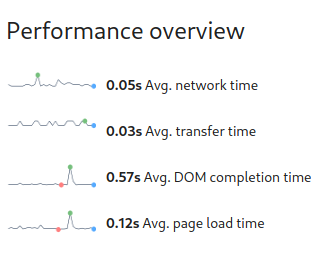
However, when “day” is selected, the performance page generates some graphs over what appears to be the past 24 hours:
From this, I assume that Matomo does have some more granular information on the performance stored somewhere after all. Is there a way to access that information via the API?
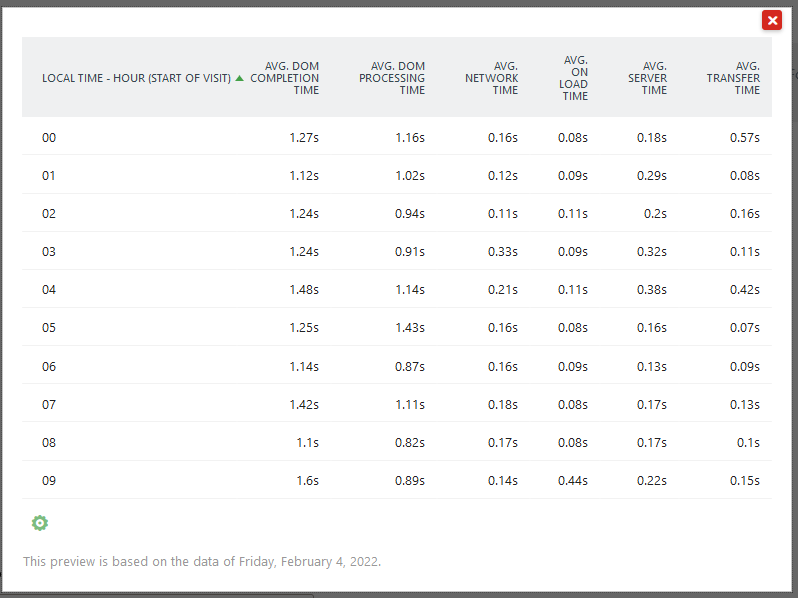
The reporting interface is limited to daily data (except the time of day reports). But you can still pull that data (BI software, automated, etc.) from the log_link_visit_action table and analyze the data more granular from there.
Or as an alternative, you can use CustomReports - First Dimension “visit hour”, metric Dom Completion time, network time, transfer time, etc.