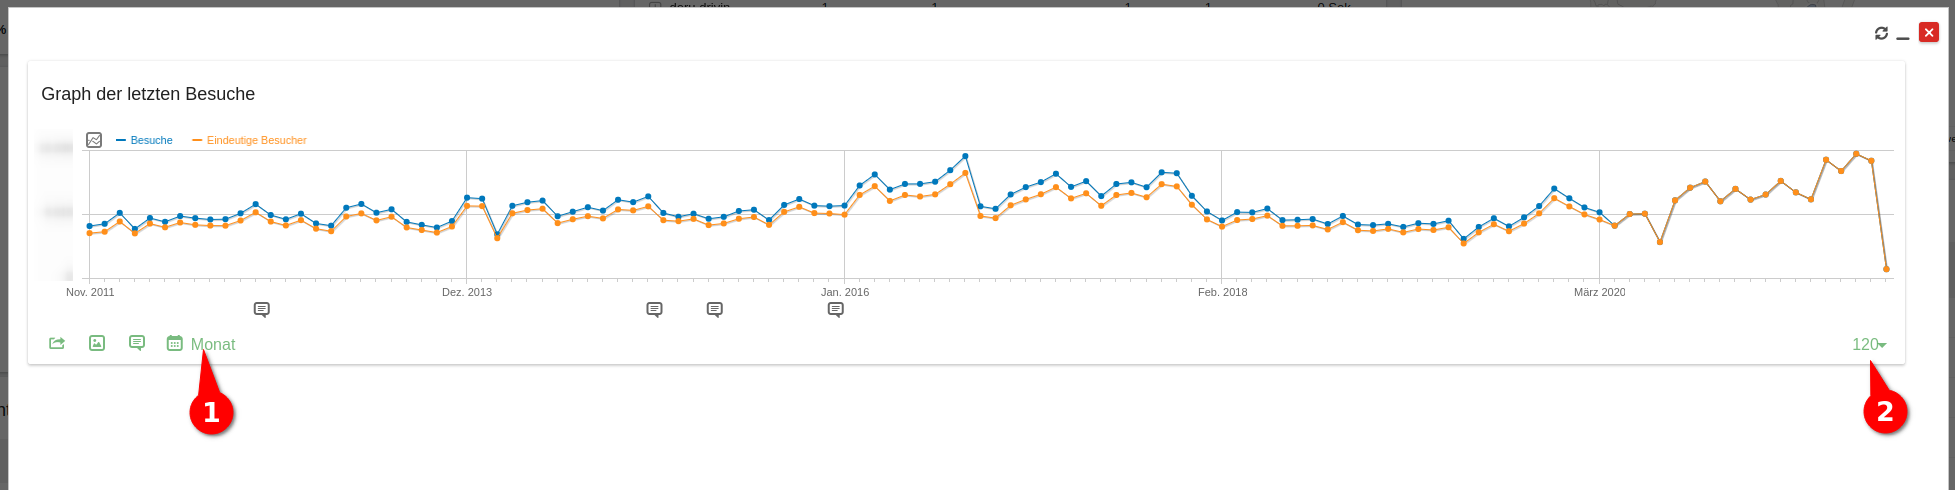
My Matomo / Piwik instance is running since 2008 and I want to create a graph of the visits evolution over the full time span.
The server is not that much powerful, and I am wondering if I have to upgrade it for just that task.
I understand that Piwik has several archiving tasks (cronjob is running) and I was expecting that data is also aggregated somehow regularily?
Now the problem is if I open the visitors overview for the full timespan:
matomo/index.php?module=CoreHome&action=index&idSite=1&period=day&date=yesterday#?idSite=1&period=range&date=2008-09-21,2021-10-03&segment=&category=General_Visitors&subcategory=General_Overview
I get a server error message because data takes to long to process (obviously).
From the URL I guess that is tries to analyse daily data - which I don’t need. A graph based the sums on weeks or month or even years would be enough.
Is there a way to set this “sampling” resolution somehow or is this impossible?
Regards,
Alex