I don’t understand the data from https://demo.matomo.cloud/index.php?module=CoreHome&action=index&idSite=1&period=day&date=yesterday#?idSite=1&period=year&date=2020-11-06&segment=&category=Funnels_Funnels&subcategory=7
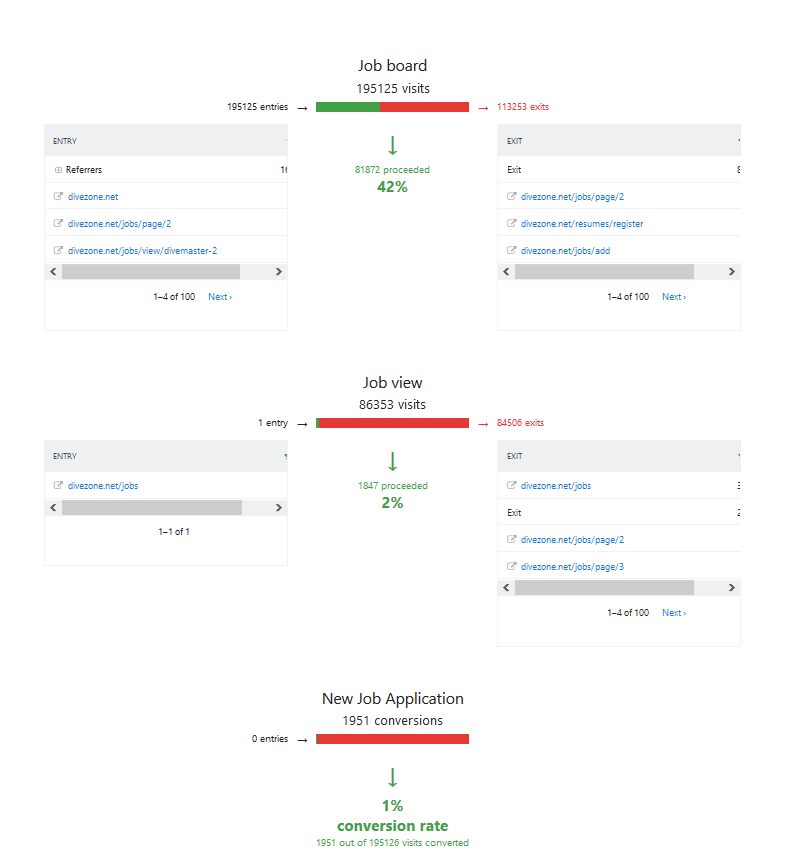
Step 1: 195125 entries / visits and 81872 proceeded (so it means 81872 who go to step 2)
Step 2: 1 entry so the number of visits should be 81872 + 1 = 81873. But the graph displays 86353 visits. I don’t understand. Then 1847 proceeded (so it means 1847 who go to step 3)
Step 3: 0 entries so the number of visits should be the same than the number of proceeders of step 2, but it is not the case.
Or maybe I missed something
Also, about the percentage (42%, 2%, 1%), is it calculated based on number of visits in step 1, or just based on the number of visits of the current step? (not the case in step 3)