On the Dashboard screen, a filter was made by date. Apply period: date range: from 2022-05-01 X to 2022-05-31.
1.1 The visits value displayed in the Visits Overview widget is 13.000.000
1.2 In the exported worksheet from the Visits over time chart, the sum of the visits column is 42.000.000
On the Dashboard screen, a filter was made by date. Apply period: date range: from 2022-05-02 X to 2022-05-31 (shorter period).
2.1 The visits value displayed in the Visits Overview widget is 31.000.000
1.2 In the exported worksheet from the Visits over time chart, the sum of the visits column is 41.000.000
Why did the visit values displayed in the overview widget increase?
Why are the visits values displayed in the overview widget not equal to the sum of visits value extracted from the Visits over time widget worksheet?
I have the same problem when exporting data from Visits overview and Visits over time widgets to a worksheet.
Example:
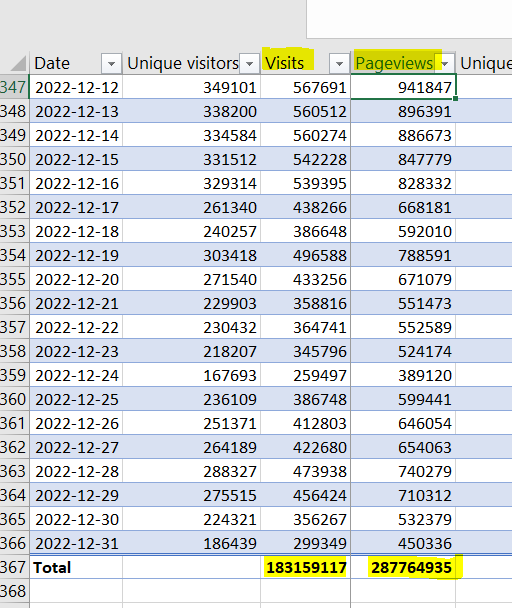
The Visits overview or Vistits over time widget reporting 179755618 visits and summing up extracted data in the worksheet returns a total of 183159117 visits . It doesn’t matter if I use a date range 1 jan - 31 dec or Year. The difference between report and worksheet is still there the same.
Anyone else having the same problem?
Is there an explanation?
Is there any way to fix this?